


Ethereum is trading below the $3,000 mark as it attempts to recover and pull up key structural levels needed to signal the beginning of a recovery. So far, those efforts have failed. Prices remain restrained by persistent resistance and market confidence continues to deteriorate.
Despite the short-term pullback, most analysts and investors expect the broader downtrend to continue, arguing that Ethereum lacks the demand and momentum needed to sustain a meaningful reversal. Sentiment has become extremely pessimistic, with traders increasingly bracing for further declines rather than a recovery.
On-chain and technical data support this cautious outlook. According to a recent CryptoQuant report, after Ethereum plummeted from a peak of $4,800, the price has been trapped in a narrow range centered around the $2,800 level for almost a month. This zone has effectively become a market purgatory. The bulls have been unable to generate the confidence needed to reclaim the highs, while the bears have repeatedly failed to force a decisive break below support.
The result is a prolonged period of volatility compression. Price movements are tense, indicating widespread indecision and lack of directional commitment among market participants. Historically, such compression has often preceded a sudden movement, but its direction remains uncertain.
Muted Layer 2 flows reflect Ethereum impasse
A recent report from CryptoOnchain highlights that Ethereum’s price stagnation is closely reflected in on-chain behavior. Weekly ETH net flows on Arbitrum, one of Ethereum’s most important Layer 2 networks and a common proxy for smart money positioning and DeFi activity, remain subdued and highly volatile.
Rather than showing clear inflow or outflow trends, this data reflects a market operating without strong convictions, reinforcing the idea that large participants are choosing to remain on the sidelines.
This directionless flow suggests that capital is not actively moving in and out of the ecosystem. Rather, investors appear to be waiting for clearer macroeconomic signals or definitive changes in market structure before committing.
In previous cycles, sustained growth in Arbitrum’s net flows has often coincided with new risk appetites or decisive trend shifts. The current inactivity stands in contrast to those circumstances.
Compressed price movements around key support levels, consistent with dormant on-chain activity, indicate a buildup of latent energy within the market. Ethereum is effectively hoisted. This equilibrium can last for a long time, but it is rarely resolved quietly. When your body is out of balance, your movements tend to be fast and forceful.
Arbitrum netflow is now an important metric to monitor. A sudden and sustained increase in flows could serve as an early signal that this long-term pending phase is nearing resolution and could set the tone for Ethereum’s next big move.

Ethereum stabilizes around $3,000 as downward pressure continues
Ethereum is trading near the $2,970 level on the daily chart, attempting to stabilize after an extended decline from the $4,800 high it hit earlier in the cycle. Although recent candlesticks indicate a modest attempt at recovery, the overall structure remains fragile. ETH continues to make new highs and lows, indicating that the bearish momentum has not yet been deactivated despite the short-term bailout rebound.
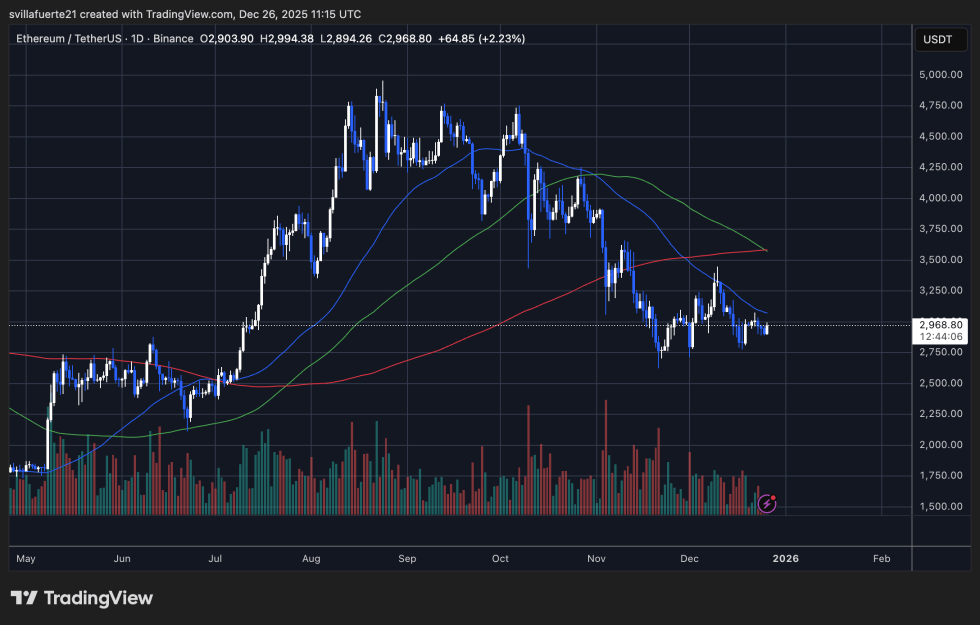
Technically, the price is still below the major daily moving averages. The faster moving averages have reversed sharply and are acting as immediate resistance, while the 111-day and 200-day simple moving averages have converged in the $3,300 to $3,600 range. This cluster forms a zone of heavy overhead supply, limiting the potential for sustained upside unless volume and momentum expand meaningfully.
The recent bounce from the $2,800-$2,900 area has helped Ethereum avoid further collapse for now. However, this move has taken place on relatively modest volumes, suggesting a lack of conviction from buyers. In contrast, the first leg decline was accompanied by strong selling pressure, reinforcing the idea that the prevailing trend continues to the downside.
From a structural perspective, the $2,800 level remains an important support. A decisive break below this zone is likely to accelerate losses and confirm bearish continuation. Conversely, for Ethereum to change momentum, the price would need to regain $3,200 to $3,300 and remain above the declining daily average.
Featured image from ChatGPT, chart from TradingView.com
editing process for is focused on providing thoroughly researched, accurate, and unbiased content. We adhere to strict sourcing standards, and each page is carefully reviewed by our team of top technology experts and experienced editors. This process ensures the integrity, relevance, and value of your content to your readers.