


Ethereum One chart shows repeated rejections at rising resistance, while another shows the price leaning toward long-term support, edging towards a major technical squeeze. Together they frame their next move as a test. $ETH It can crack the ceiling or bounce off the floor.
Ethereum trendline faces fourth test after three rejections
Ethereum has tested the long-standing uptrend line three times in the past two years, but each attempt ended in rejection. A resistance line drawn across the past swing high limits upside movement beyond 2024. However, repeated tests continue to push the price towards its ceiling, narrowing the distance between resistance and higher lows.
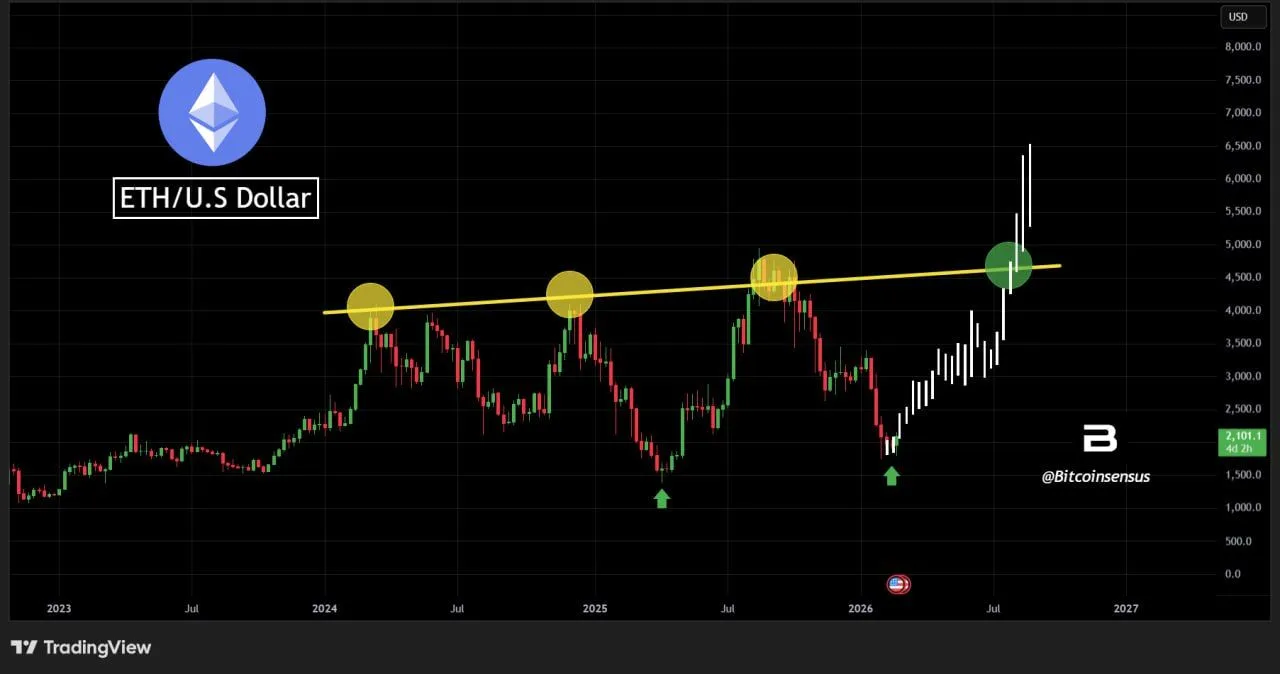
$ETH/USD Multi-Year Uptrendline Test: Source: Bitcoin Census of X
In a chart shared by market commentator Bitcoin Census, the first rejection formed around the mid-$3,000 level in early 2024. A few months later, Ethereum rallied again and tagged the same ascending resistance line, prompting sellers to intervene. In 2025, the third rally reached the trend line again, triggering a further decline. Despite these failures, the broader structure shows higher troughs marked by rebound points after each adjustment.
As a result, the setup resembled a compression pattern. Prices continue to swirl below the upside barrier while buyers defend higher support levels. In technical terms, repeated retests of resistance may reduce selling pressure as remaining supply at that level may be gradually absorbed. If the fourth approach gains momentum, the trendline could face a definitive breakout attempt.
At the same time, the resistance line remains in place until the price closes firmly above it. Although the previous uptrend stalled shortly after touching the line, it is confirmed that sellers are still monitoring that zone. Therefore, the next move has structural importance. If a break is confirmed, it would change the multi-year pattern and pave the way for a historically increasing supply zone. Conversely, if it is rejected again, the scope will expand and structural change will be delayed.
For now, Ethereum is trading in a tightening formation below the uptrend line, but market participants are watching to see if repeated pressure will finally overturn the resistance it has held for years.
Ethereum Remains Long-Term Support as Analyst Bias Remains Below $2,000
Ethereum is trading near the long-term support trendline on a two-week chart shared by market analyst James Easton, who stated that “plans remain unchanged” and set the sub-$2,000 zone as an accumulation area. In his post to
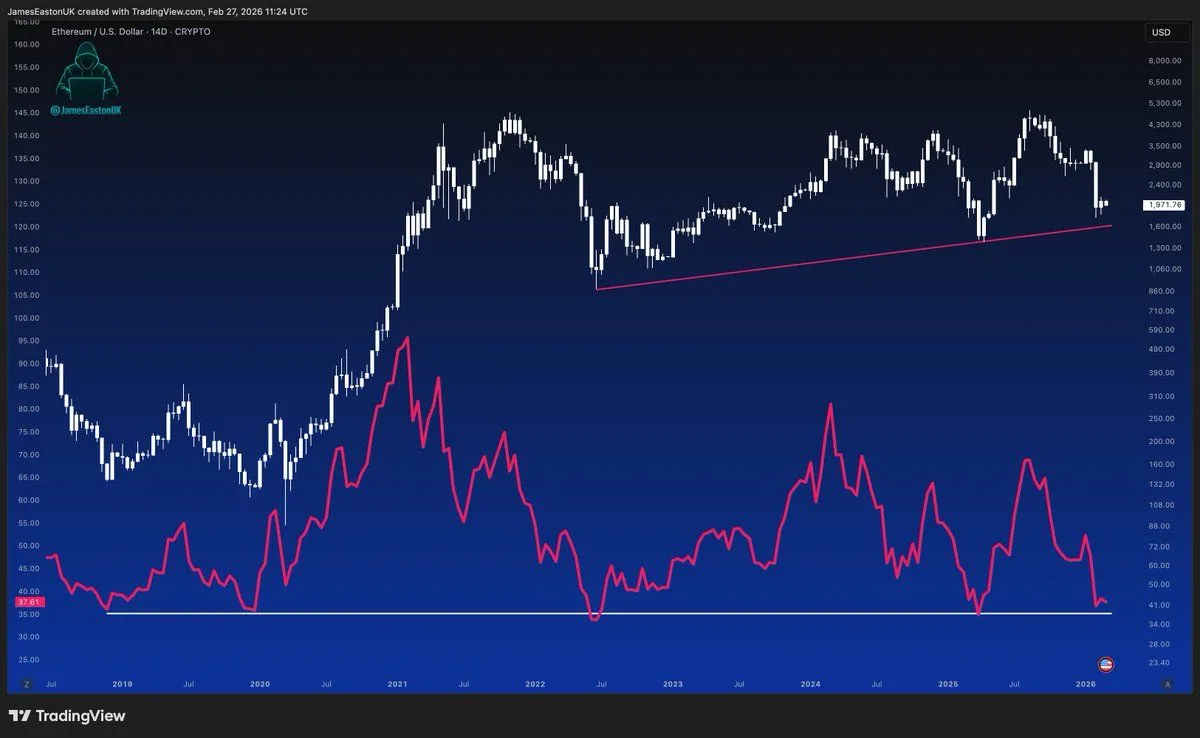
Ethereum USD 14-day Trendline Support and Momentum: Source: JamesEastonUK’s X
This chart shows that Ethereum’s broad structure is moving into a gradual uptrend after the 2022 drawdown, with price action compressing towards the support line that has been raising the lows. This support lies below the latest consolidation range and coincides with the previous rebound zone on the right side of the chart.
The red momentum line plotted below the price also trended lower into early 2026, approaching a flat baseline marked around the low $30s. This indicator has previously spiked during large upswings and then reversed during pullbacks. This suggests that momentum is slowing even though the long-term trend line remains intact.
Easton’s post focuses on simple thresholds rather than breakout targets, with levels below $2,000 serving as a reference point. However, this chart still leaves us with the same technical question: Will Ethereum be able to rebound from trendline support and rebuild momentum, or will further decline force a deeper reset before a sustained rally?