


As of March 12, 2026, Bitcoin traded at approximately $70,523 per unit, with a market capitalization of approximately $1.41 trillion and a 24-hour trading volume of nearly $47.04 billion. The price range for the session widened from $69,034 to $71,230, with the market hovering around the middle of that band while technical indicators brought a mixture of cautious optimism and mild skepticism.
Bitcoin chart outlook
On the daily time frame, Bitcoin’s price structure reflects market consolidation after the rebound from the $59,900 area. Bitcoin has primarily fluctuated between about $64,000 and $74,000, forming a series of lower lows that gradually move higher, suggesting stable demand below the surface.
Current price action is looming towards the $70,000 to $71,000 area, placing the asset near the upper end of its recent range. The broader structure remains within a range rather than a definitive trend, which helps explain why momentum indicators are hesitant to pick sides.
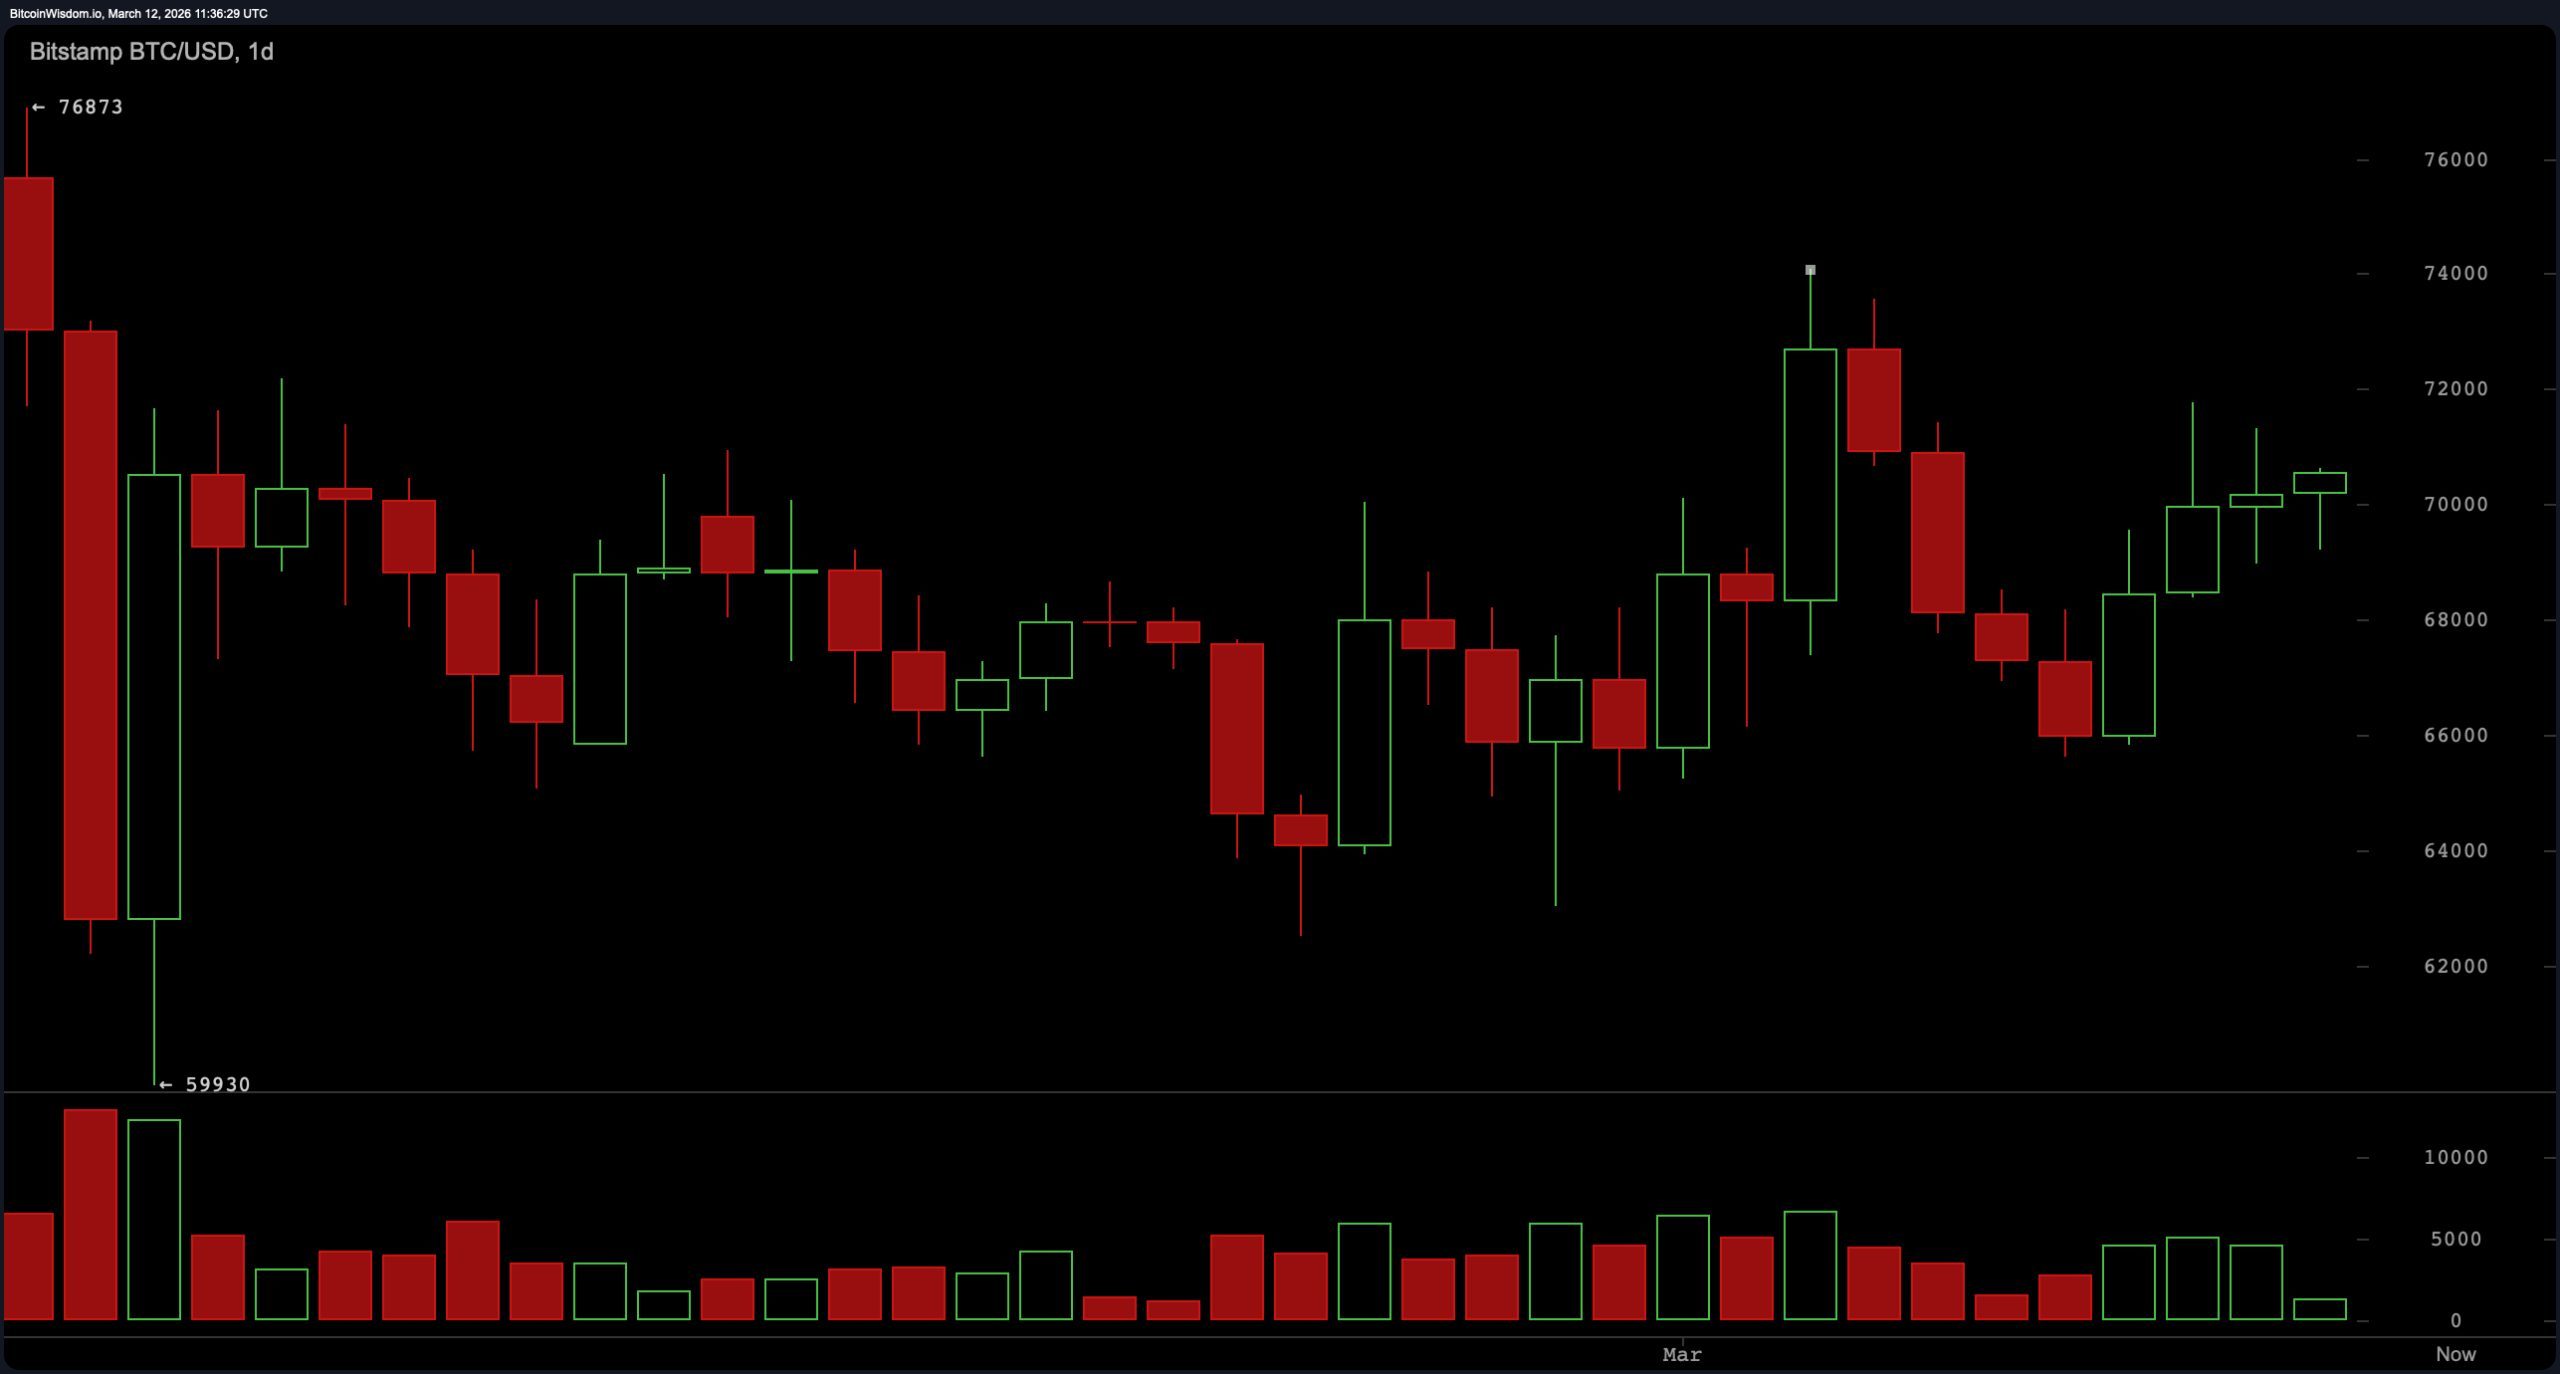
$BTC/USD 1-day chart via Bitstamp on March 12, 2026.
The 4-hour chart shows a slightly more constructive picture. There was a clear uptrend earlier this week, with prices rising from around $65,600 to around $71,175 before entering a controlled decline. Rather than breaking down, the retracement stabilized around the $69,000 to $69,500 area and began recording higher lows. The pattern resembles a continuation structure, with the price repeatedly finding footing near the $69,000 area. Resistance remains concentrated between $71,100 and $72,000, a zone that has repeatedly slowed the advance.
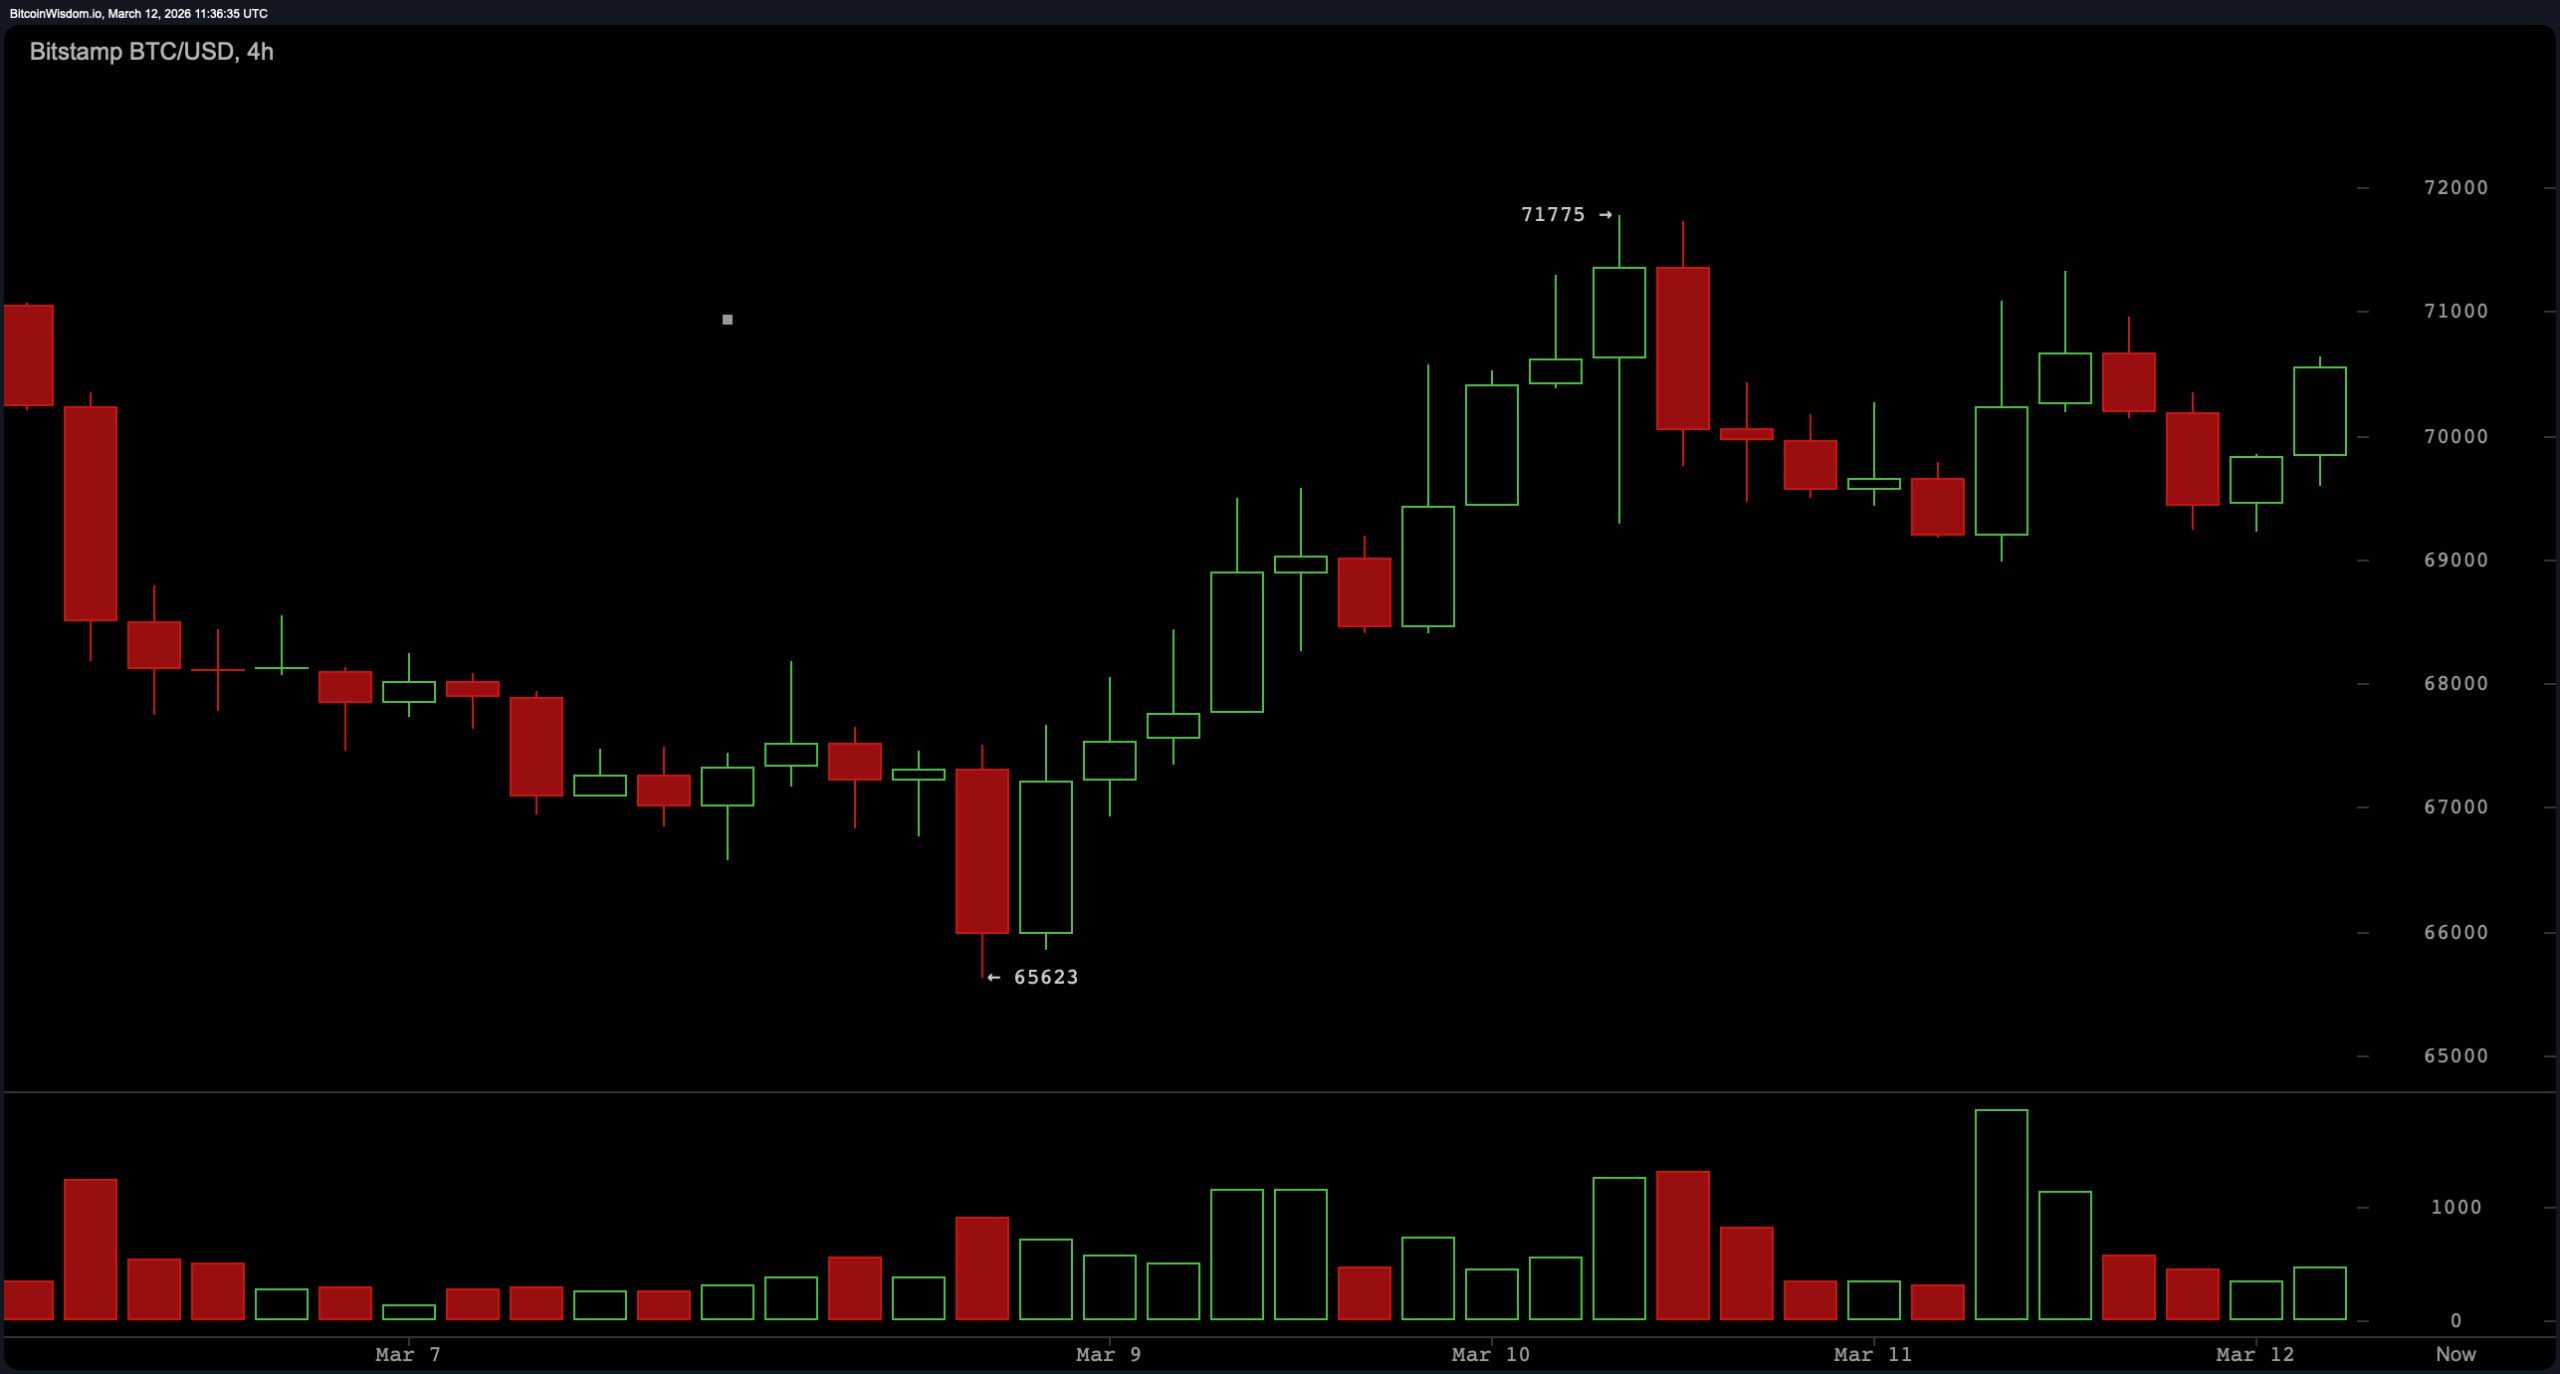
$BTC/USD 4-hour chart via Bitstamp on March 12, 2026.
The short-term activity on the 1-hour chart shows the microstructure behind its stabilization. After establishing a local bottom around $68,991, Bitcoin rose through a staircase pattern with new lows near $69,300, $69,800, and $70,200. These advancing candlesticks are generally small and methodical rather than explosive, suggesting gradual accumulation rather than desperately chasing momentum. In other words, buyers appear to be willing to intervene during downturns, but not necessarily kicking down the door.
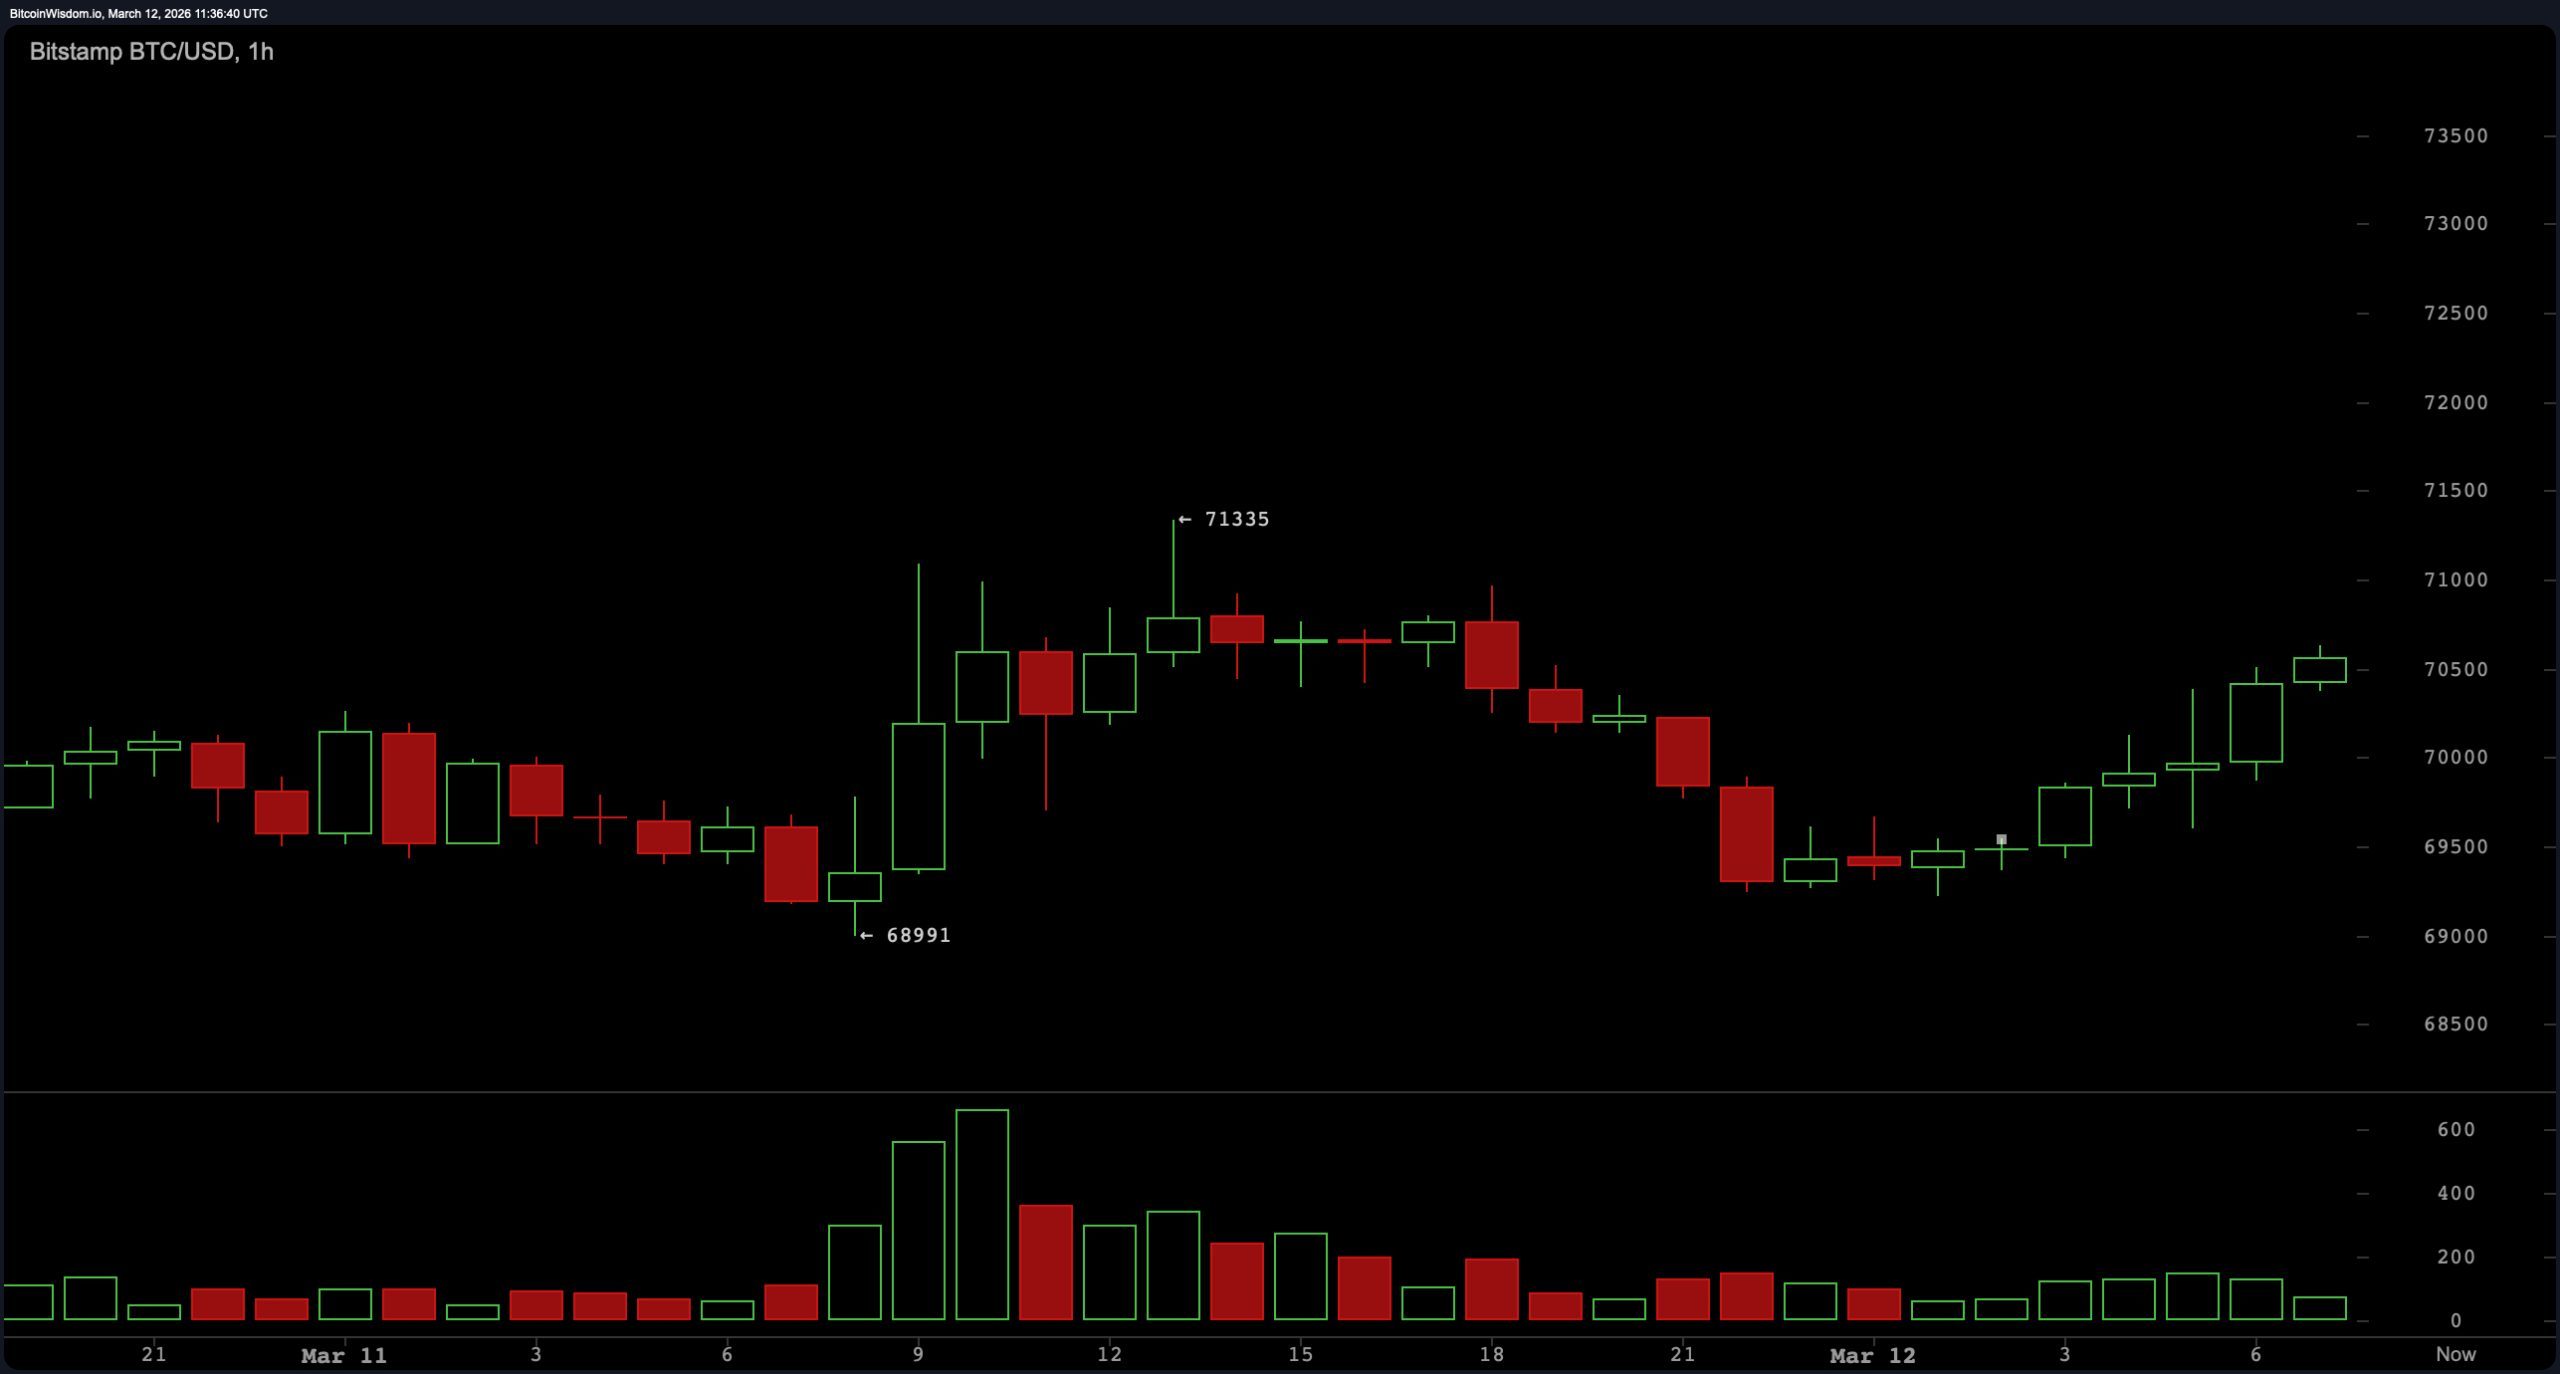
$BTC/USD 1-hour chart via Bitstamp on March 12, 2026.
The oscillator paints an almost neutral image. The relative strength index (RSI) is 52.4, which puts momentum almost perfectly in the middle of its range. The stochastic percentage is 65.2, while the product channel index (20) is 96.8 and the average direction index (14) is 27.0, all indicating a neutral situation.
The Awesome Oscillator recorded 832.3 and the Stochastic Relative Strength Index is 76.1, again neutral. The two indicators are negatively slanted with Momentum (10) at 1,731.0 and Bullish Bear Power at 2,081.9, while Moving Average Convergence Divergence (MACD) Level (12, 26) displays -533.0 with a positive signal reading. The total across the oscillators shows two negative signals, eight neutral readings, and one positive signal. This is technically equivalent to a collective shrug.
Moving averages tend to be slightly more constructive the shorter the period. The exponential moving average (EMA) (10) is $69,056.0 and the simple moving average (SMA) (10) is $69,243.0, both below the current price. The EMA (20) of $68,962.7 and SMA (20) of $67,981.2 are also still below the market price, along with the EMA (30) of $69,939.2 and SMA (30) of $67,933.5.
However, longer-term measures still loom overhead, with the EMA (50) at $72,924.0 and the SMA (50) at $72,448.6, followed by the EMA (100) at $80,024.6 and the SMA (100) at $81,373.5. Even higher is the EMA (200) at $88,323.9 and the SMA (200) at $94,526.1. That is, short-term averages are supportive, while long-term averages linger over your head like a skeptical attendant.
Bullish verdict:
As of March 12, 2026, Bitcoin’s structure is trending cautiously constructive. Although the price is above several short-term moving averages, including the $69,056 exponential moving average (10), the $69,243 simple moving average (10), and the $68,962 exponential moving average (20), the market continues to make more lows on the 1-hour and 4-hour charts. The oscillators are mostly located in neutral territory rather than overextended levels, historically leaving room for directional expansion. If the price remains stable above the $69,000 support zone and breaks through the resistance between $71,100 and $72,000, a broader top near $74,000 becomes the next technical magnet.
Bear verdict:
Despite short-term stabilization, the broader technology structure still faces significant overhead pressures. Bitcoin remains below multiple long-term moving averages, including the Exponential Moving Average at $72,924 (50), the Simple Moving Average at $72,448 (50), the Exponential Moving Average at $80,024 (100), and the Exponential Moving Average at $88,323 (200). The oscillator also shows limited confidence, with momentum (10) and bullish bear power recording negative signals, although most other indicators remain neutral. If the repeatedly tested $69,000 support area fails, downside pressure could quickly expose lower technical levels around $67,800, $66,000, and potentially broader support around $64,000.
Frequently asked questions 🔎
- What is the price of Bitcoin on March 12, 2026?
As of March 12, 2026, Bitcoin is trading around $70,523 with a 24-hour range of $69,034 to $71,230. - What are Bitcoin’s technical indicators currently showing?
Most oscillators, including the Relative Strength Index (RSI), exhibit neutral momentum, while moving averages are slightly positive in the short term. - What are Bitcoin’s major support and resistance levels?
The technical chart shows support near $69,000 and resistance between $71,100 and $72,000. - Is Bitcoin trending up or down in the short term?
Bitcoin’s short-term structure shows higher lows on the 1-hour and 4-hour charts, suggesting modest upward momentum in the broader range.