


With Bitcoin’s price at $89,907, a market capitalization of $1.79 trillion, and active 24-hour trading volume of $45.09 billion, it’s clear that the crypto king is not taking a nap. But despite an intraday range between $88,532 and $90,788, the chart paints a picture more of an attitudinal waiting game than a breakout success.
Bitcoin chart outlook
On the hourly chart, Bitcoin price action resembles a volatile tango between a support floor at $88,500 and a resistance ceiling at $91,000. When the price reaches the top of the range, a short-term burst of volume appears, only to be met with a rejection like a dance partner stepping on a toe.
The intraday rhythm favors a tactical entry around $88,800 to $89,200, unless the structure breaks below $88,300. Unless buyers suddenly learn how to overcome the resistance with conviction, a better time to exit is around the $90,300 to $90,800 mark.
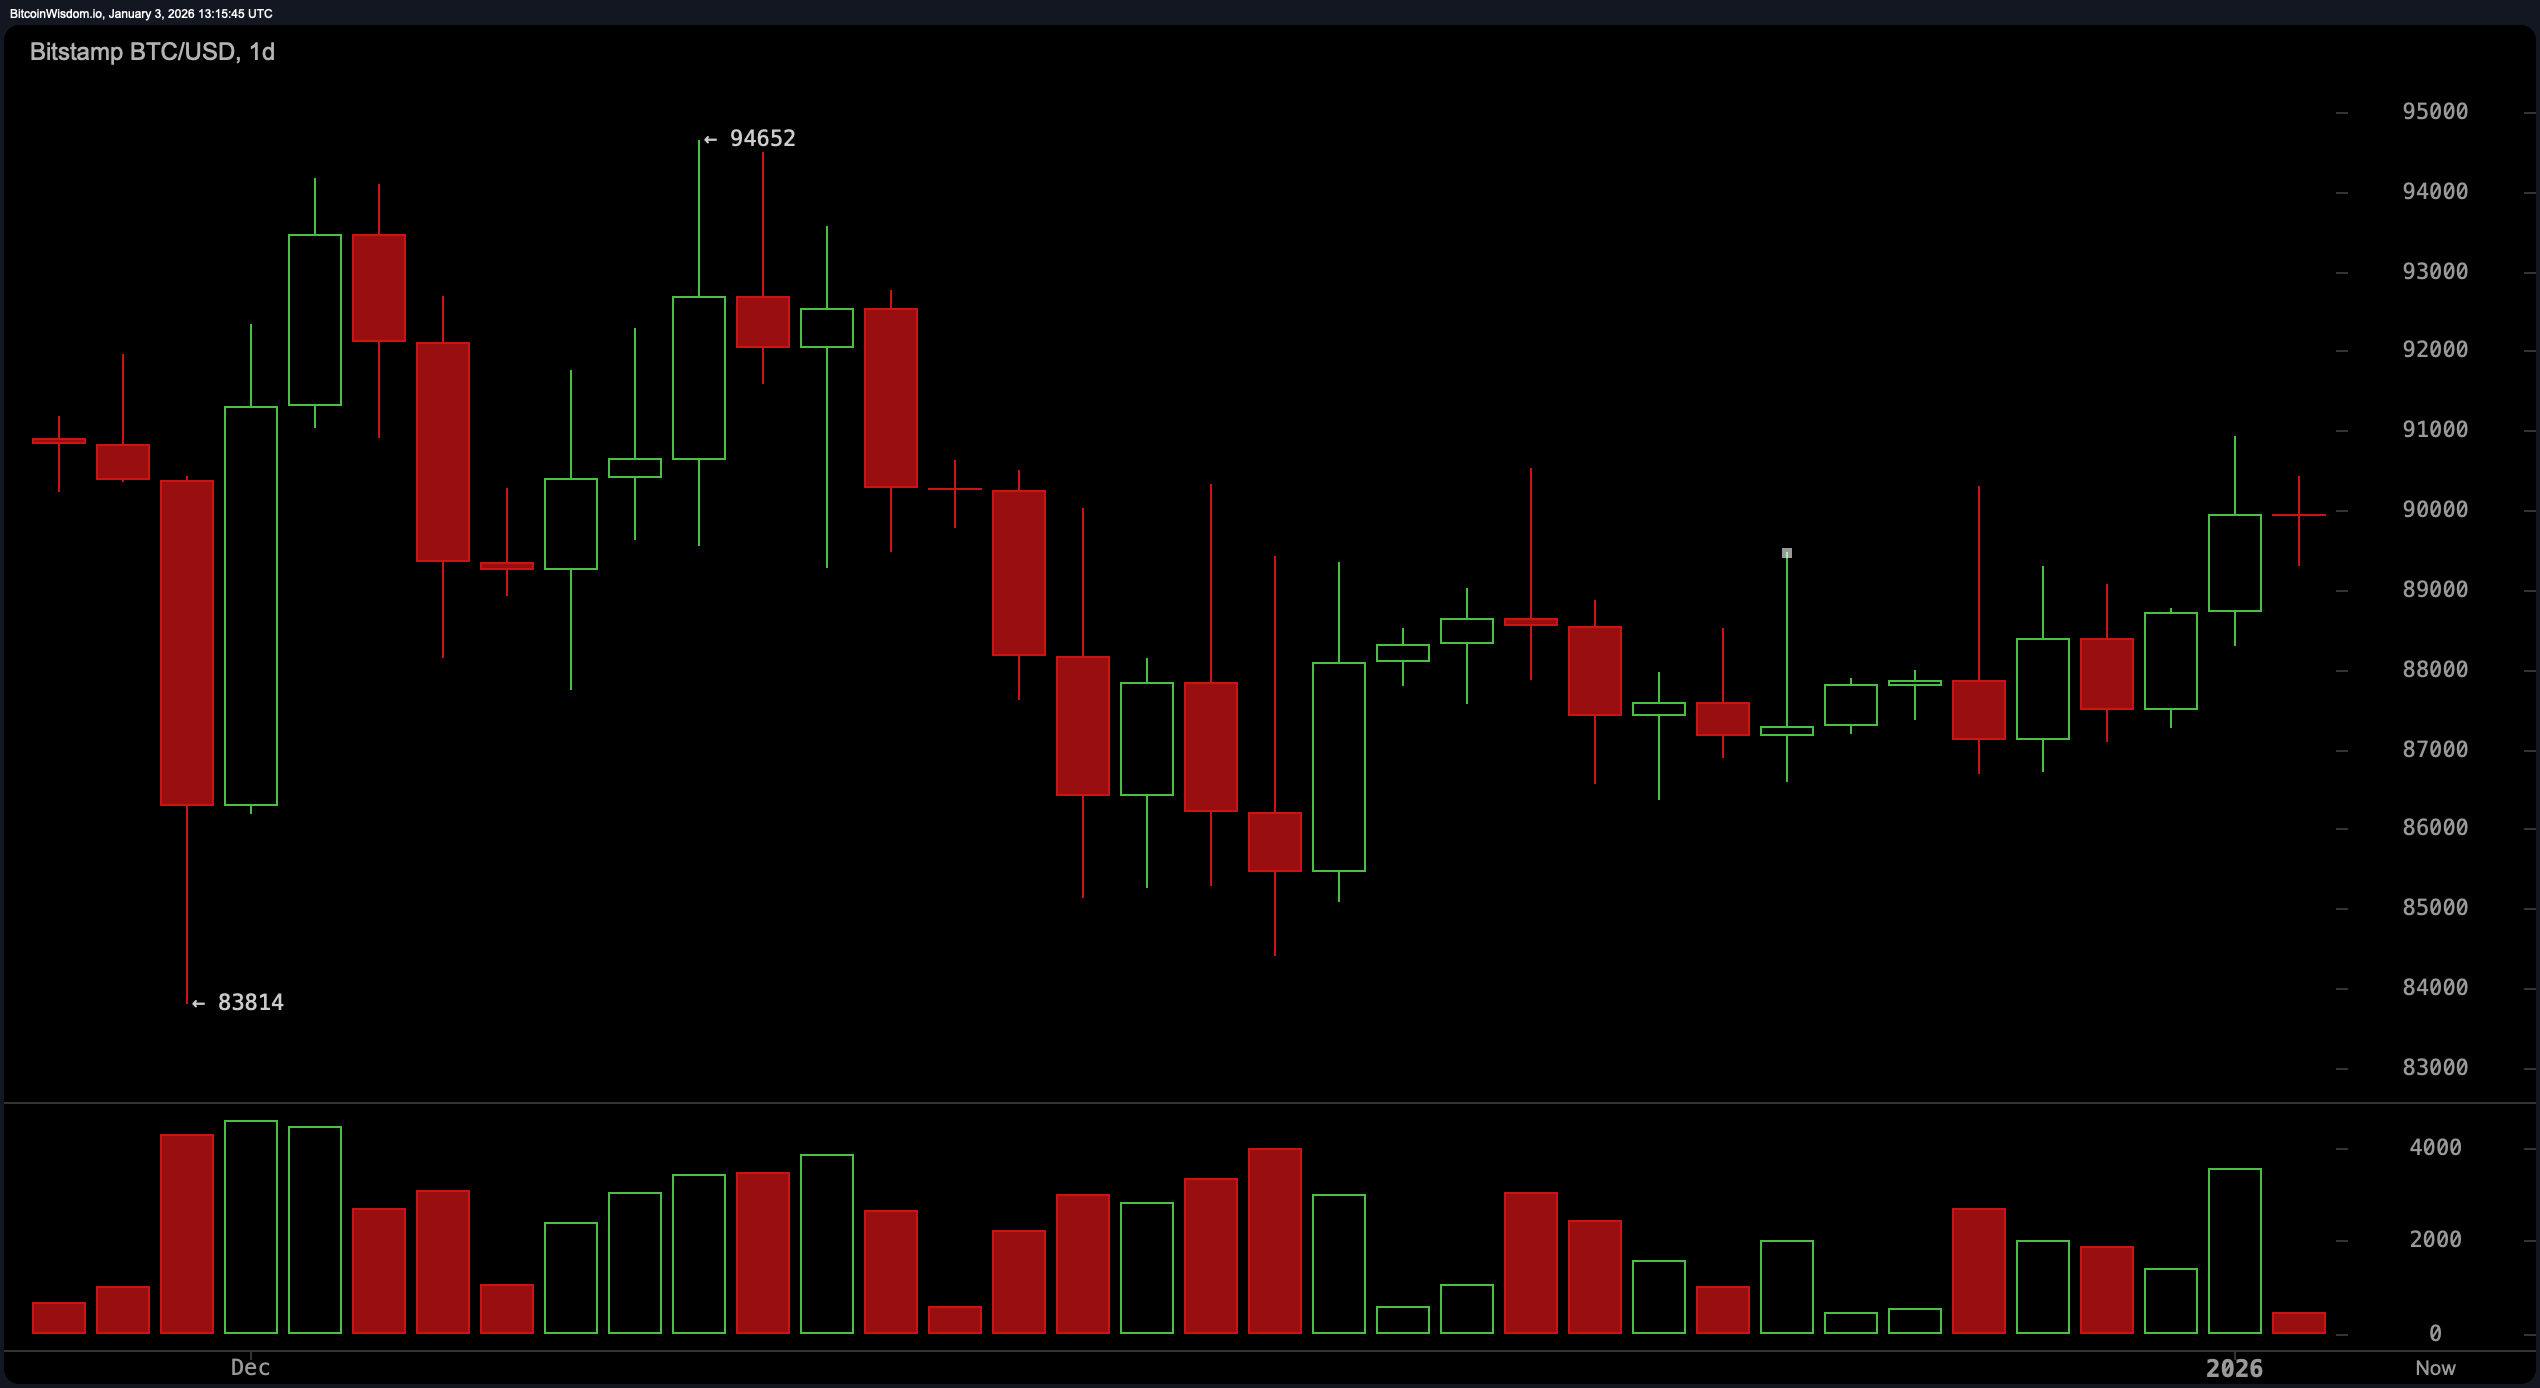
BTC/USD 1-day chart via Bitstamp for January 3, 2026.
Zooming out to the 4-hour chart, the situation becomes one of cautious optimism. Since January 1st, Bitcoin has recorded highs and lows, which is impressive, if not entirely convincing. Dips is guarded but has the enthusiasm of a sleepy guard dog. Attempts to break out of the $90,900-$91,000 level continue to be rejected, suggesting that buyers may be saving energy and cash for another day. A break below $87,500 will cap this fragile rally, so traders should keep that line in the rearview mirror.
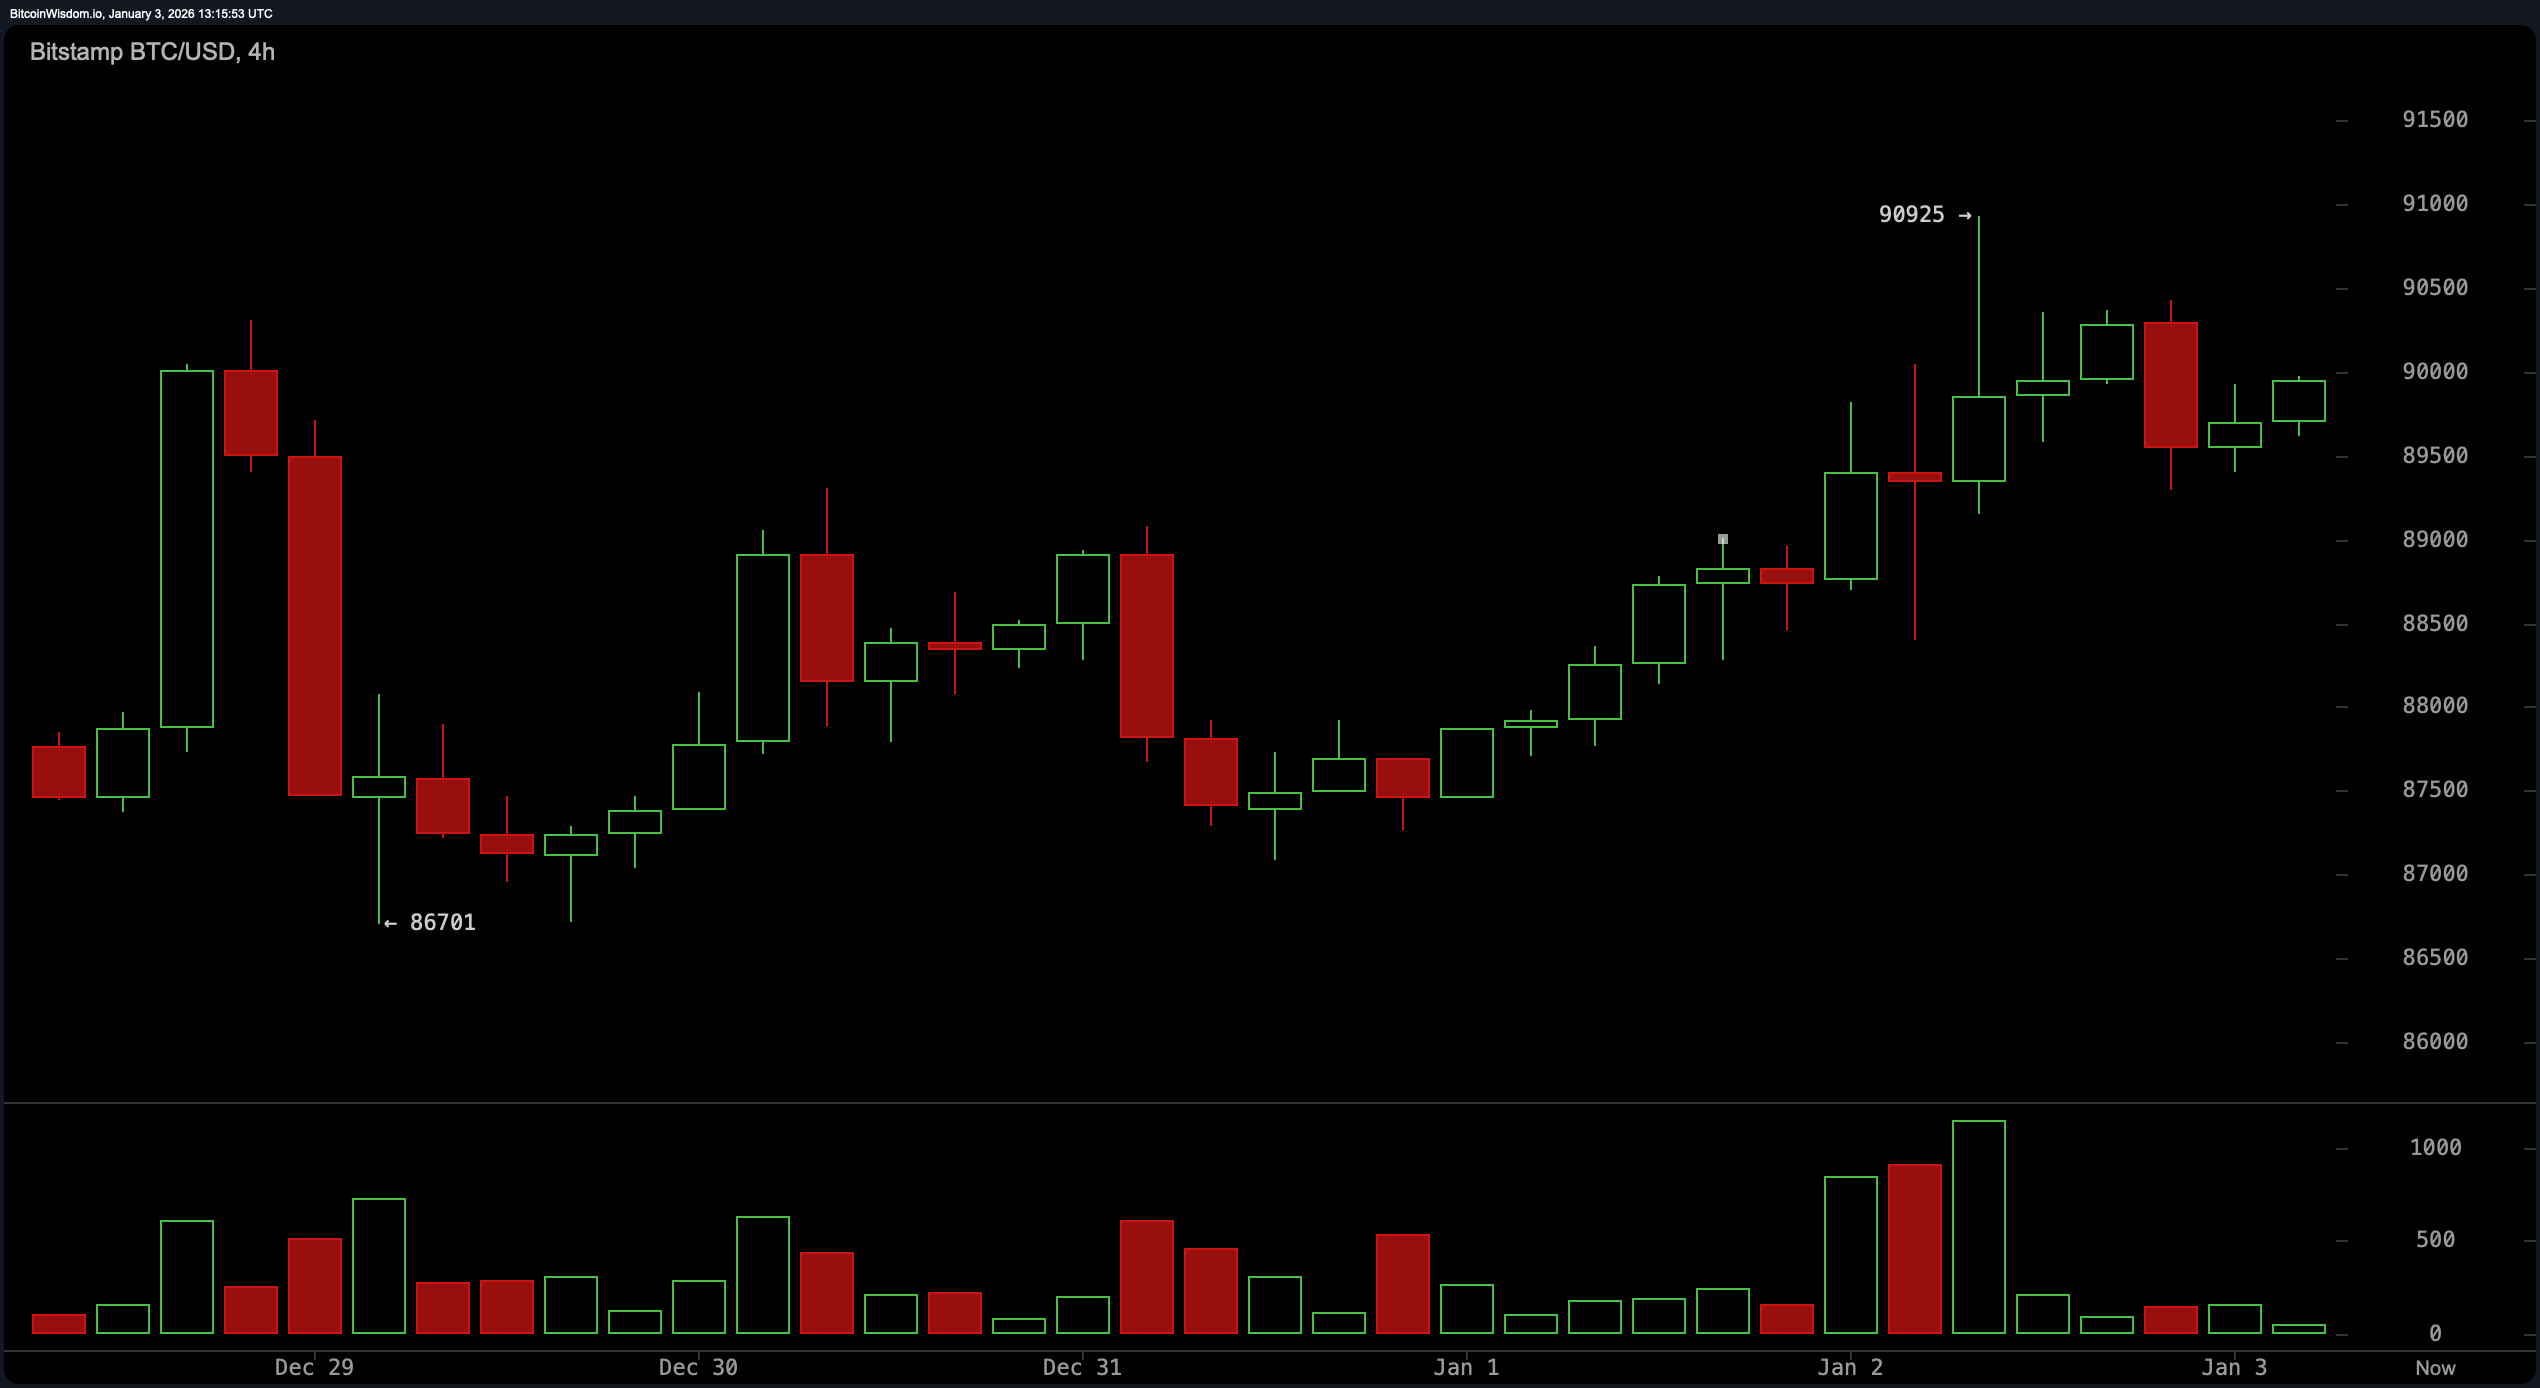
BTC/USD 4-hour chart via Bitstamp on January 3, 2026.
Looking at the daily chart, you can see that Bitcoin is frankly in no rush. Prices are comfortably hovering in the lower half of the $84,000-$95,000 range, above the December low of $83,800, but a long way from reclaiming the $94,500-$95,000 top. Barring a convincing daily close outside the $86,000-$92,000 zone, this range is likely to continue. Volume isn’t necessarily rushing to the party either, supporting the idea of consolidating past the breakout crescendo.
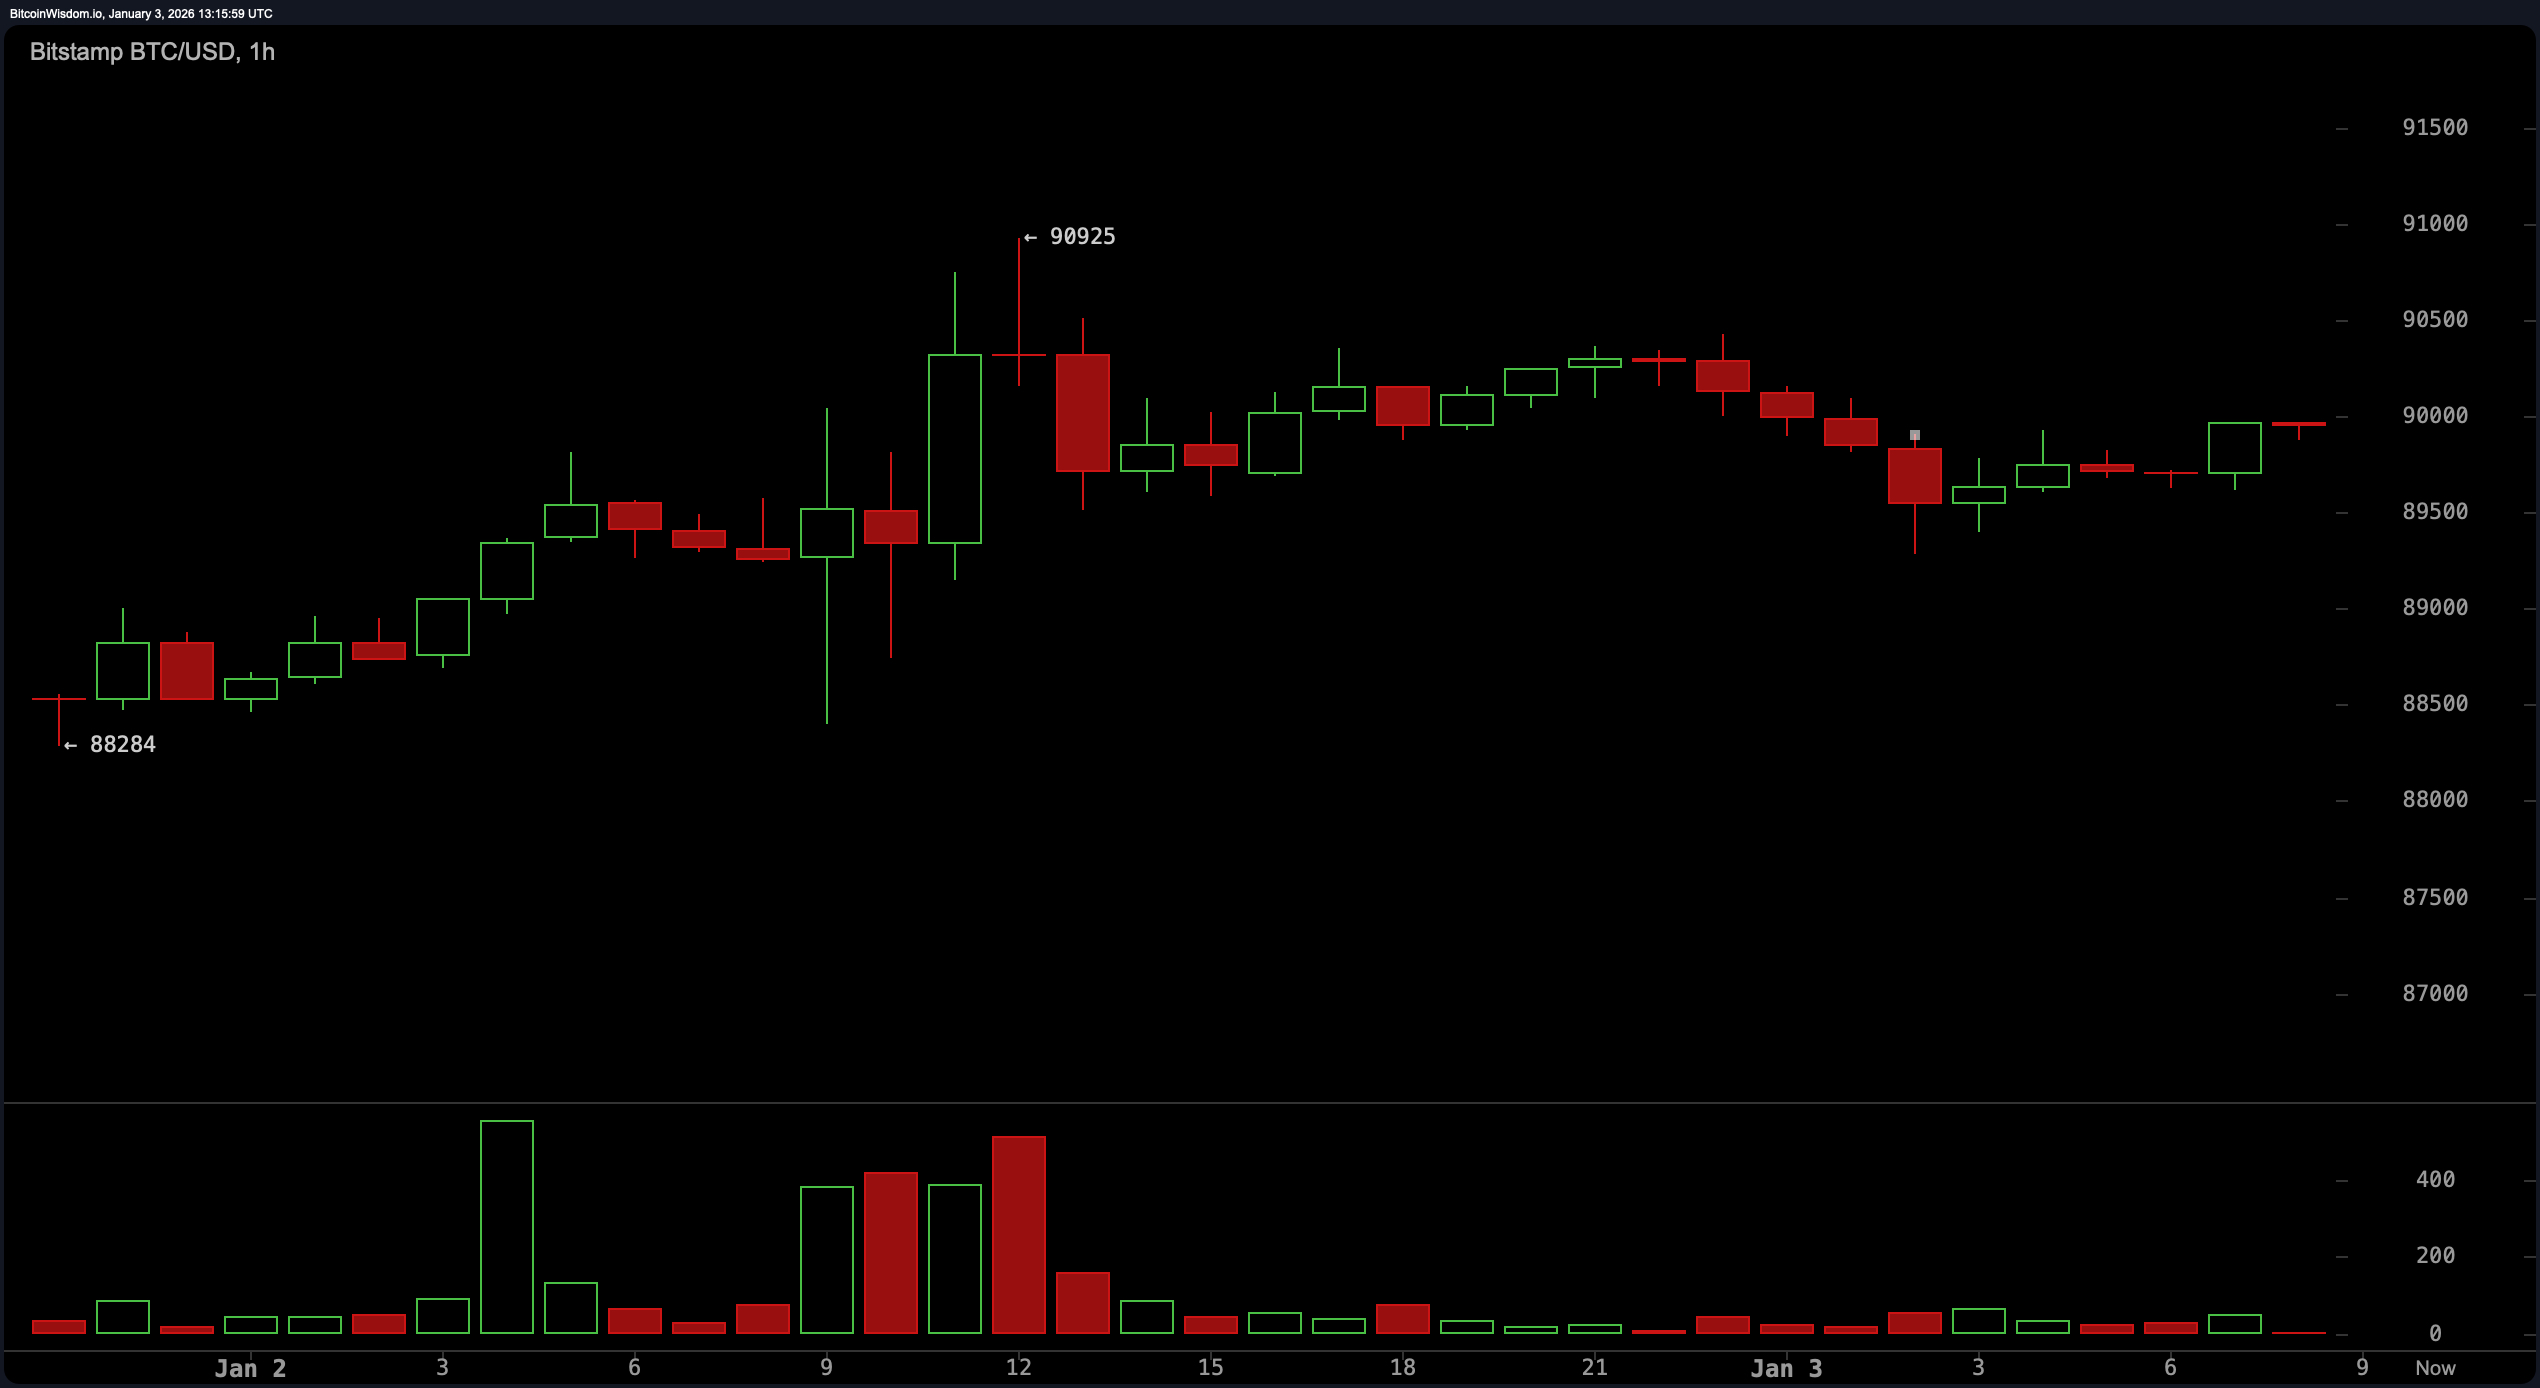
BTC/USD 1-hour chart via Bitstamp on January 3, 2026.
Oscillators are similarly indecisive. The Relative Strength Index (RSI) shows a neutral 54, while the Stochastic Oscillator is at 74 (not too hot, not too cold). The Commodity Channel Index (CCI) at 209 and the Momentum Indicator at 2,272 are both bearish, but they are not dragging the other indicators down. The Moving Average Convergence Divergence (MACD) value is at -410, providing quiet grounds for a slight upside rally, while the Awesome Oscillator is adding a neutral chorus at a subdued -370.
Moving averages (MAs) are caught in a tug of war of their own. Short-term exponential moving averages (EMAs) and simple moving averages (SMAs) (including 10, 20, and 30 period variants) are all supporting the current price trend, giving it a modest nod. However, the 50-period EMA has turned away, and the 100- and 200-period moving averages are squarely pessimistic, pointing well above the current price. The jury is divided, but one thing is clear: the burden of proof is on Bitcoin bulls.
In short, Bitcoin hasn’t given away its secrets yet. We’re in a range at the moment, and unless prices move decisively above $92,000 or forcefully below $87,000, the best trades will be those that lighten the load and preserve a quick exit.
Bullish verdict:
If Bitcoin can regain territory above $92,000 with volume increases that don’t dissipate like a sunrise fog, the path to the $94,500 to $95,000 zone is once again open. Rising short-term moving averages and lows across multiple time frames suggest that the bulls have not lost the script and are just gaining attention.
Bear verdict:
If Bitcoin convincingly breaks below $87,000, the range structure will break and attention will quickly turn to the $84,000 level. The bears may not be charging yet, but they are certainly cycling, as the long-term moving average is now firmly above the price and several oscillators are showing caution.
Frequently asked questions ❓
- What is the current price of Bitcoin? Bitcoin is trading at $89,907 as of January 3, 2026.
- Is Bitcoin in a bullish or bearish trend? Bitcoin remains in a neutral range between $88,532 and $90,788.
- What are Bitcoin’s major support and resistance levels?Support lies around $88,300 to $89,000 and resistance lies between $90,800 and $91,000.
- Are technical indicators currently bullish on Bitcoin?Most oscillators and moving averages show mixed signals, favoring movements within a range.