


Bitcoin, the digital darling of financial disruption, traded at a price of $88,199 on Wednesday, January 21, 2026. The market capitalization of this crypto asset reached an impressive $1.77 trillion, backed by a 24-hour trading volume of $58.07 billion. Bitcoin toyed with both danger and opportunity as the intraday price range increased from $87,777 to a high of $91,201. It’s the kind of volatility that makes chart watchers reach for the Fibonacci tool before they even have a cup of coffee.
Bitcoin chart outlook
On the daily chart, Bitcoin has clearly broken out of its parabolic sprint and taken a detour into a severe correction. The recent peak near $97,939 is now a distant memory, with the price settling near $88,000, where a long downside indicates potential support amidst seller exhaustion.
A sharp red candlestick rise in volume suggests a panic liquidation rather than a strategic exit. Although the bearish engulfing pattern in this time frame overshadows bullish expectations, the long tail suggests that bullish buying is still lurking. If the candlestick narrows above this support and the price consolidates with decreasing volume, a return to the $92,000-$94,000 resistance area is still possible.
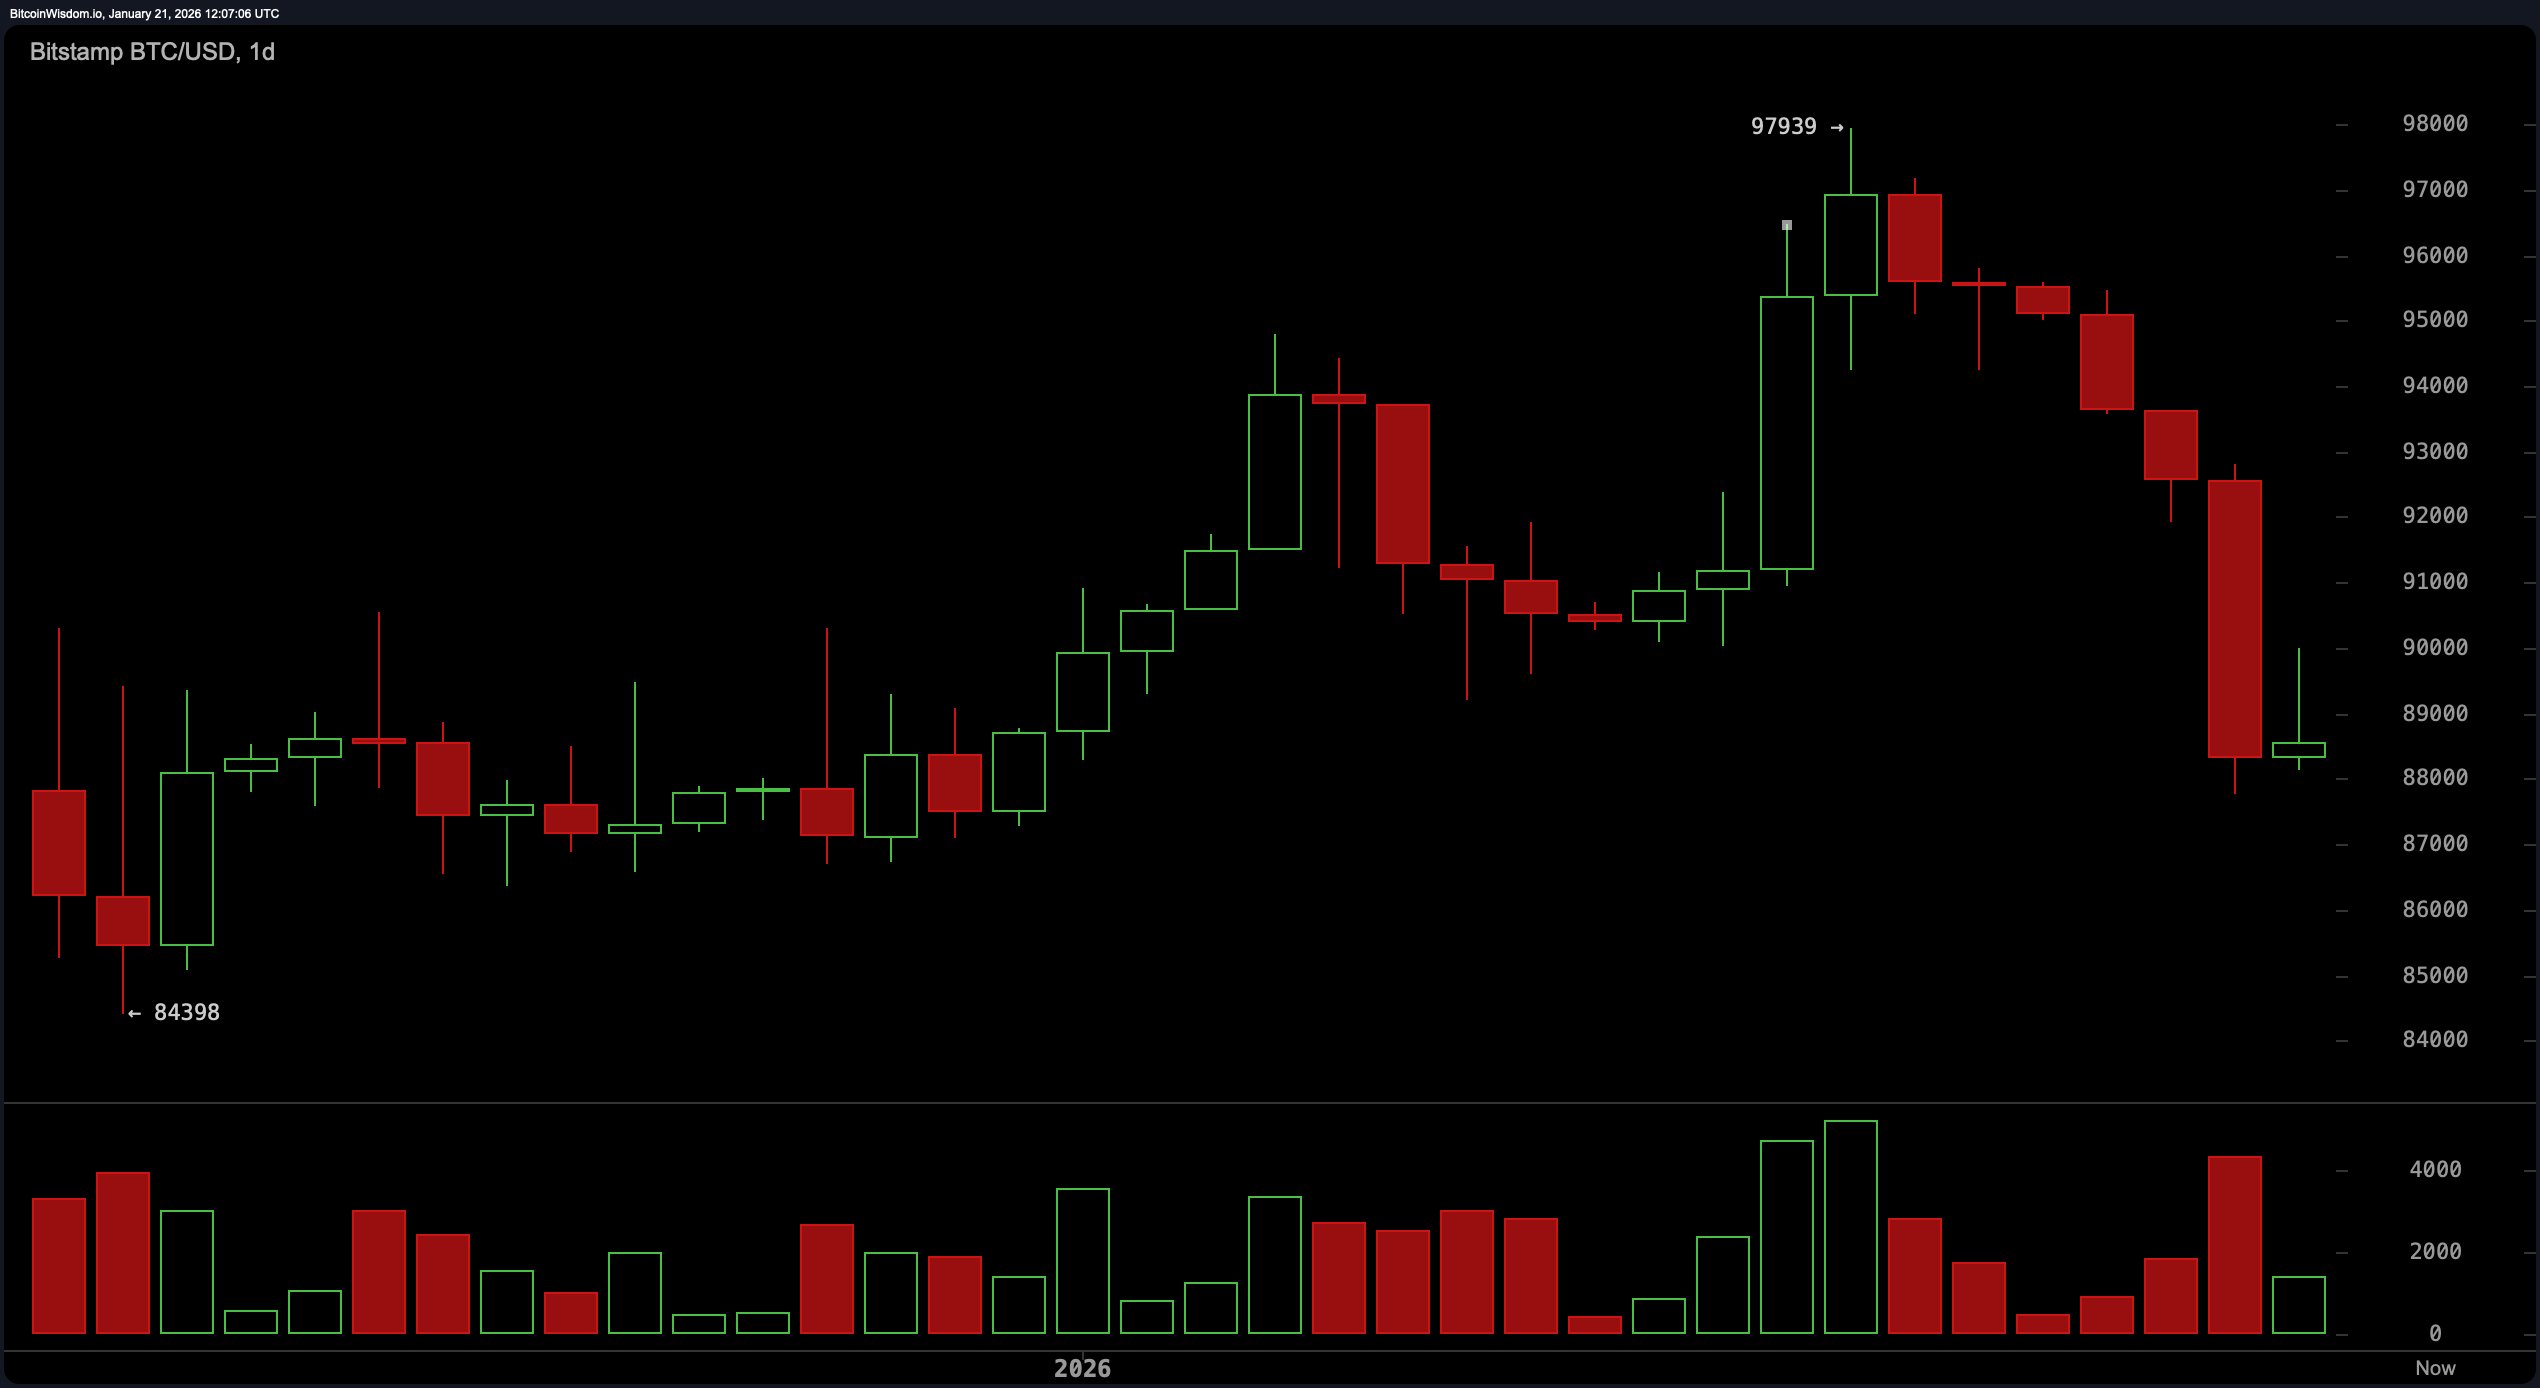
$BTC/USD 1-day chart via Bitstamp for January 21, 2026.
The four-hour chart tells a darker story, with textbook highs and lows, the classic symptoms of a bear market. A brief reprieve appeared at the $87,777 mark, but the red volume bar asserts prevailing selling pressure. Still, the recent weakening of bearish momentum could be a temporary respite if a double dip or a low above $88,500 is formed. A decisive move above $90,000 could target $91,500-$92,000, but absent a strong recovery, a pullback toward $87,000 remains possible. This chart whispers a warning louder than Wall Street analysts during earnings season.
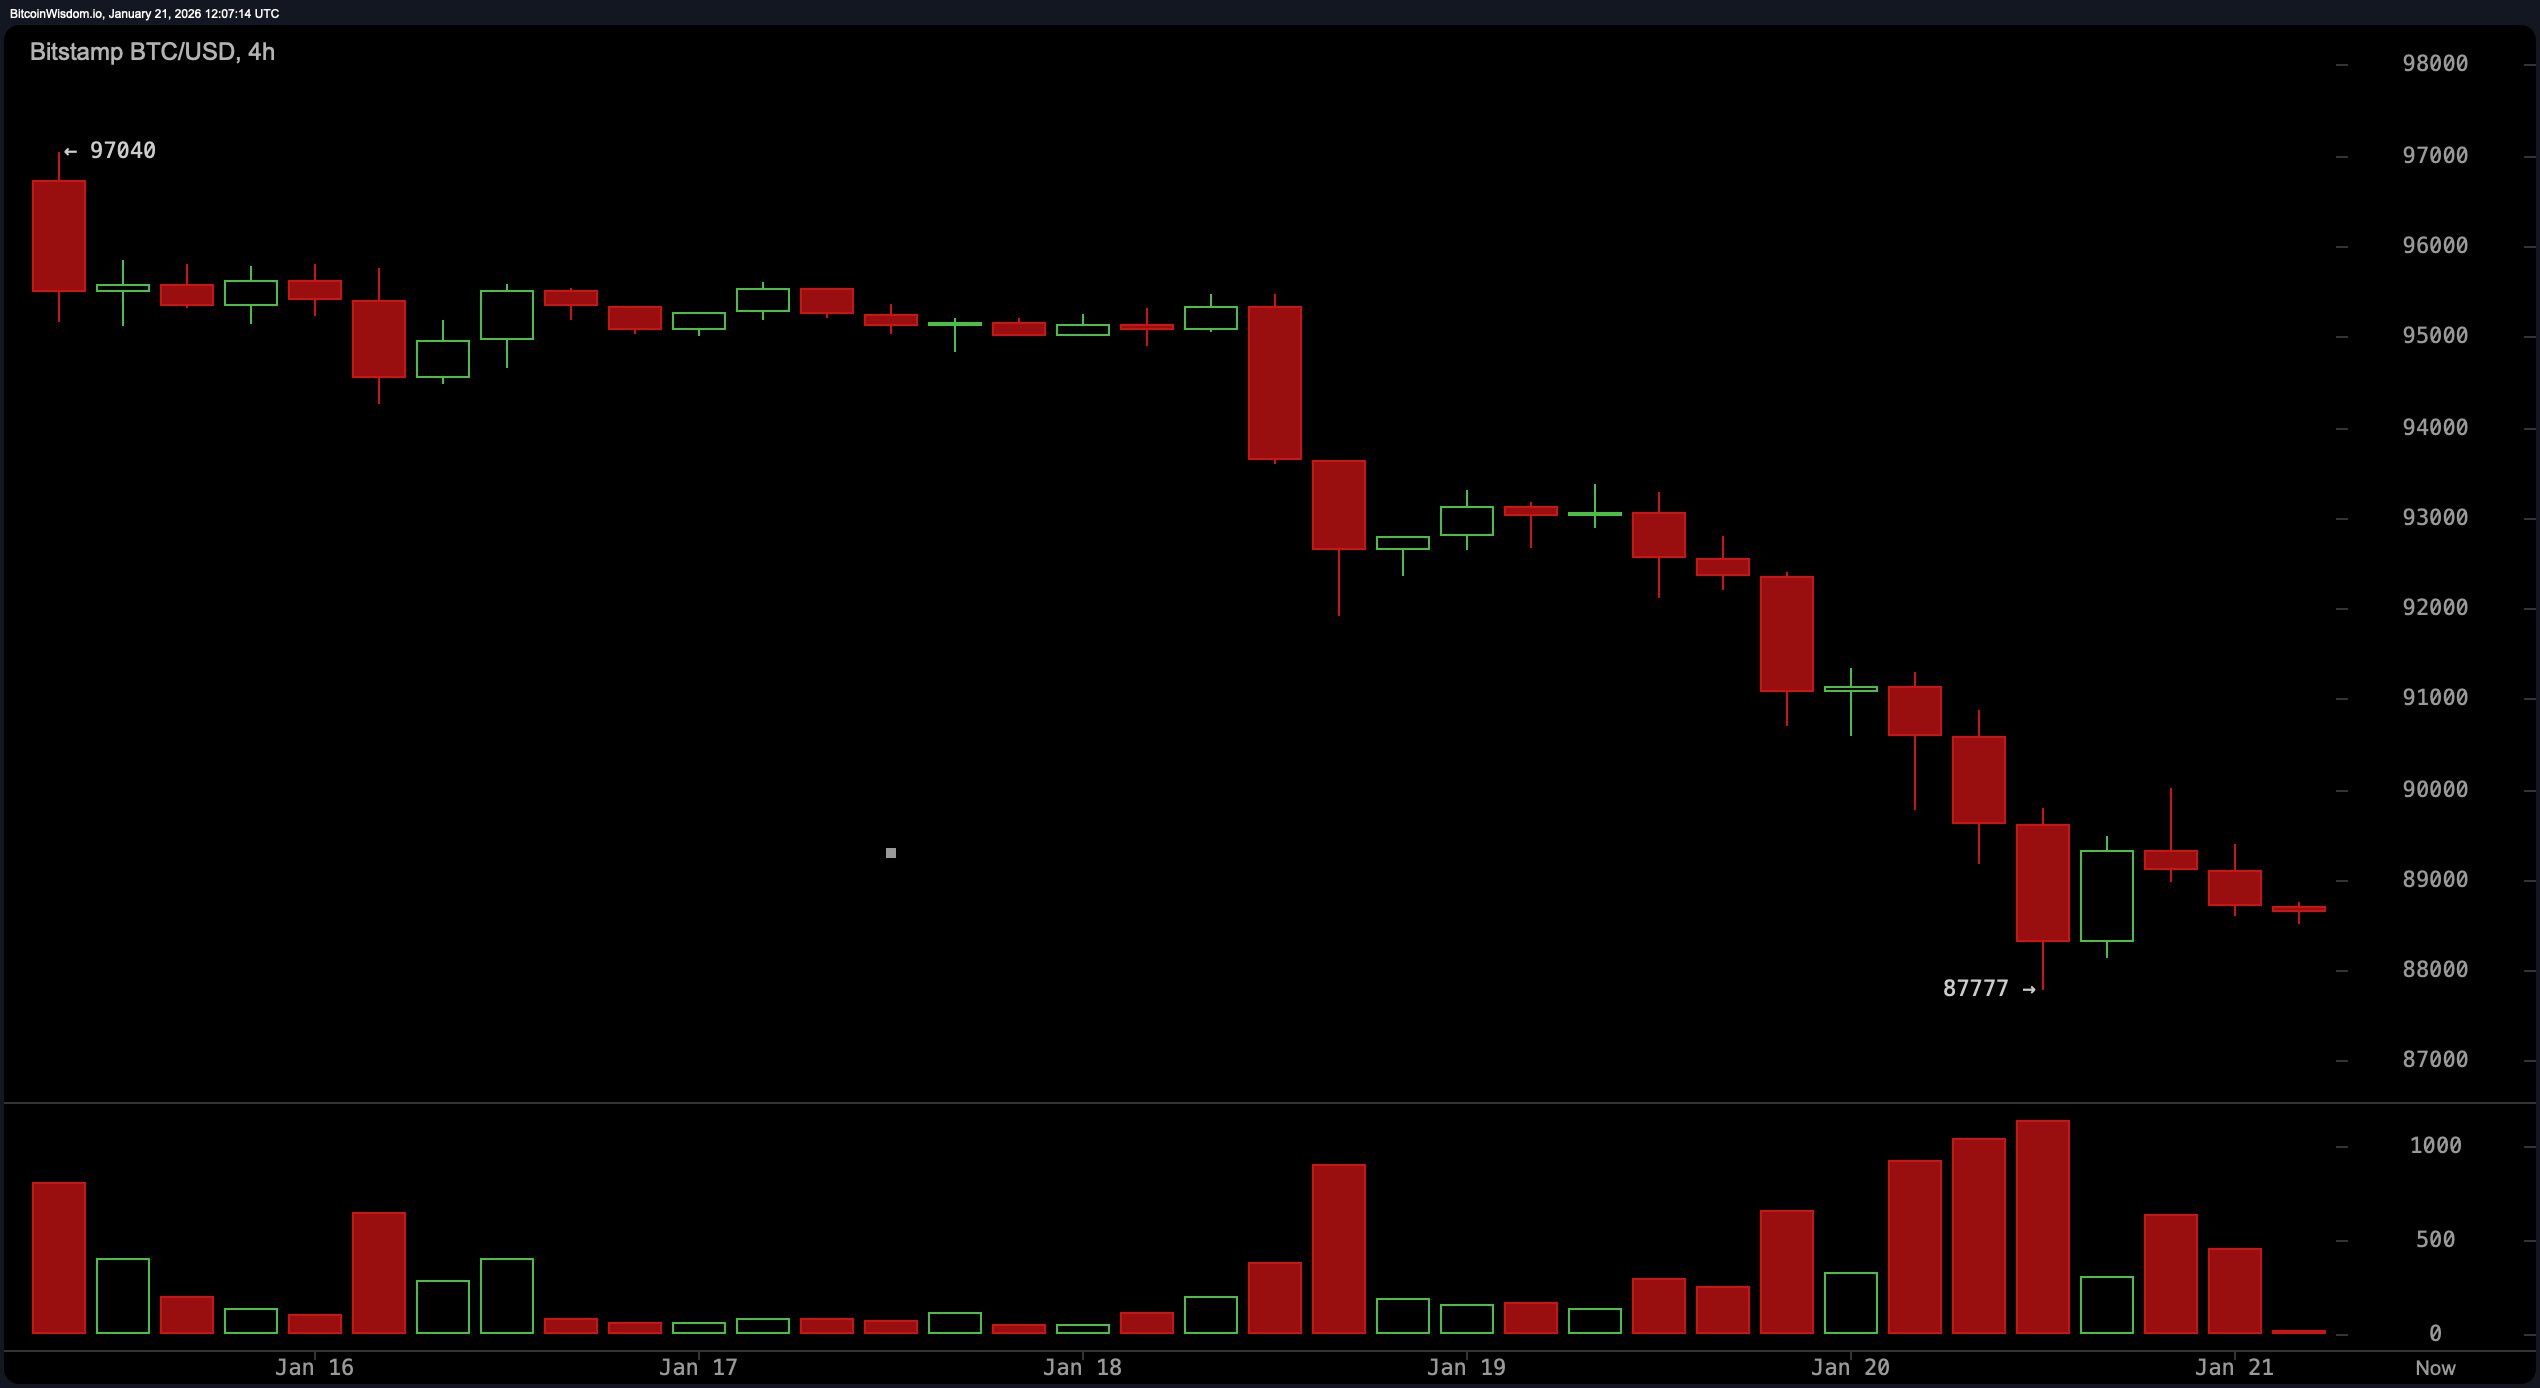
$BTC/USD 4-hour chart via Bitstamp on January 21, 2026.
Zooming in on the hourly time frame, the market appears to be writing a suspenseful script, wrapping itself around a descending triangle, or perhaps a classic bearish flag. The rebound from $87,777 lacked the celebratory volume needed to inspire real confidence. Sure, a green candle appeared, but unless it’s loud enough to throw a party, it’s just noise. If $88,000 holds and the price manages to break through $89,000, we could see a quick push into the $90,000-$91,000 area. However, if Bitcoin falls below $88,000 with conviction, the target between $85,500 and $86,000 quickly comes into focus.
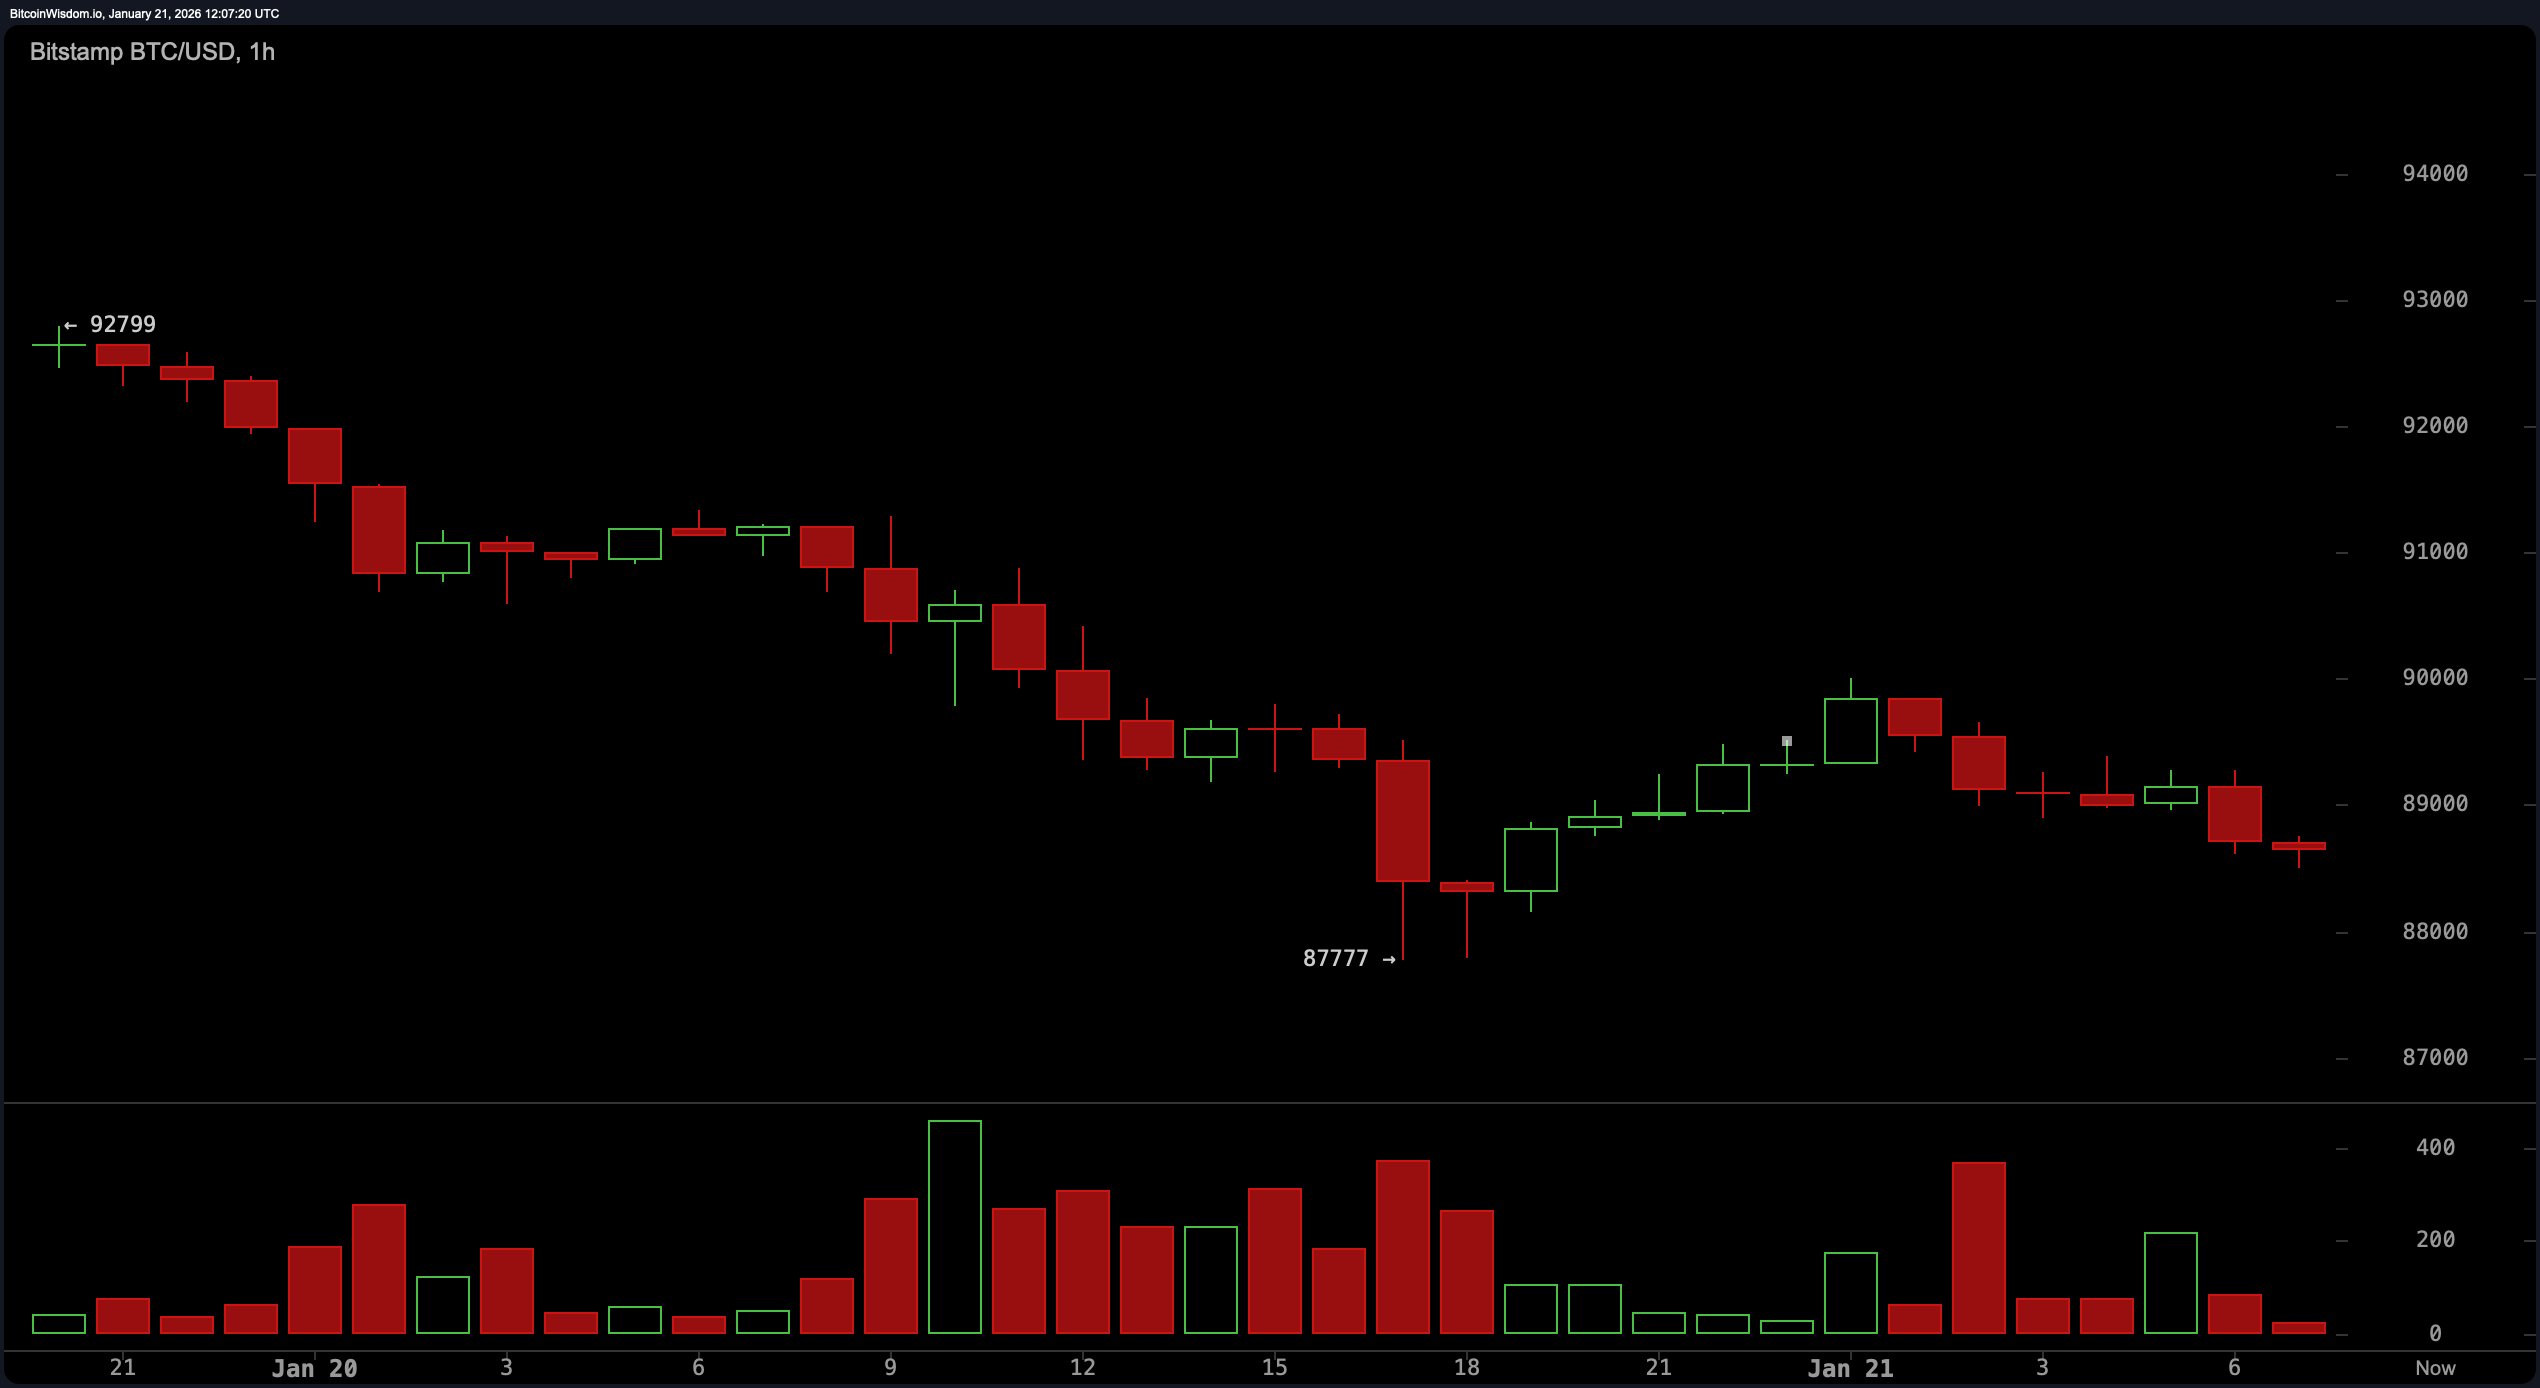
$BTC/USD 1-hour chart via Bitstamp on January 21, 2026.
Wednesday’s oscillator is also showing a poker face. The Relative Strength Index (RSI) remained at 41, the Stochastic Oscillator at 17, and the Commodity Channel Index (CCI) at -112 in negative territory, all indicating signal neutrality. The average directional index (ADX) is 30, indicating that while it’s still not a power lift, it does tend to have some muscle. While the great oscillator reflects neutrality, the momentum indicator and Moving Average Convergence Divergence (MACD) levels are warning with negative readings, suggesting a potential bearish undertone. In this environment, momentum traders need to be careful on exit and perhaps recheck their stop losses.
Moving average line? They’re not here to comfort anyone. All tracking moving averages, including Exponential Moving Averages (EMAs) and Simple Moving Averages (SMAs) over 10, 20, 30, 50, 100, and 200 periods are stacked against a bullish narrative. The 10-period EMA is $91,912 and the 10-period SMA is $93,289, both of which are trading well above the current price, putting downward pressure on the stock. The 200-period EMA and SMA have reached $99,126 and $105,535, respectively, giving Bitcoin bulls a very long way to go if they want to regain the upper hand. For now, this trend is not their friends, but their probation officer.
Bullish verdict:
If $88,000 remains solid and Bitcoin gathers enough volume to break above $89,000, momentum could head toward the $90,000 to $94,000 resistance corridor. This setup coincides with a rebound from key daily support and a short-term depletion of selling pressure, providing traders with a textbook recovery strategy. But bullish optimism must be combined with tactical discipline, because without follow-through, it’s just a false head in a volatile market.
Bear verdict:
This structure is still tilted toward instability, with all major moving averages currently holding above the price like bearish sentinels. If Bitcoin falls below $88,000 with volume, the next stop could be in the $85,500 to $86,000 range, confirming a break from the current consolidation pattern. The bears will maintain a smug, chart-adhering advantage until key resistance levels are decisively restored.
Frequently asked questions 🐂 🐻
- What is the current price of Bitcoin? Bitcoin is trading at $88,199 as of January 21, 2026 at 7:30 a.m. ET.
- Which major support levels should traders focus on?The $88,000 level is acting as important short-term support.
- Where will Bitcoin’s next major resistance be?Resistance is forming in the $90,000 to $94,000 area.
- Is Bitcoin currently in a bullish or bearish trend?Current indicators show a bearish trend and recovery signals are weak.