


ETH price has formed a very bullish continuation pattern, with a breakout above this confirmed that could propel the token to all-time highs in the coming months.
summary
- ETH price is down about 9% after failing to break out of the $4,700 resistance level earlier this week.
- A multi-month bull flag pattern is forming on the weekly chart.
Ethereum (ETH) price fell 4% to an intraday low of $4,329 on October 9, afternoon Asian time, after bulls failed to break out of the $4,600 resistance late last night, according to data from crypto.news. At the current price, the token is down about 9% from its weekly high of $4,753 reached on Tuesday on the back of a broader market rally driven by project-specific catalysts and renewed optimism across the cryptocurrency industry.
This rally was partially fueled by historically bullish sentiment surrounding October, a month known for strong seasonal gains in cryptocurrencies. Macro tailwinds such as strong inflows into Spot Ethereum ETFs and expectations for dovish central bank policies also contributed to the upward momentum.
However, the tide started to turn on October 7th as Ethereum failed to break out of the $4,700 resistance level for the second time in the past 30 days. This pullback was caused by a combination of profit taking by short-term traders, widespread market liquidations, and a recovery in the US dollar, all of which weighed on investor sentiment and put downward pressure on ETH prices.
You may also like: As the market cools down, Bitcoin price bounces around the $120,000 correction, will it be able to resume its rise?
It is currently forming a huge bullish flag pattern on the weekly chart as ETH price continues to fall following the recent high level rejection. In technical analysis, this pattern appears when the price of an asset rises sharply and then consolidates in a downward channel, often showing a pause before the next leg rises.
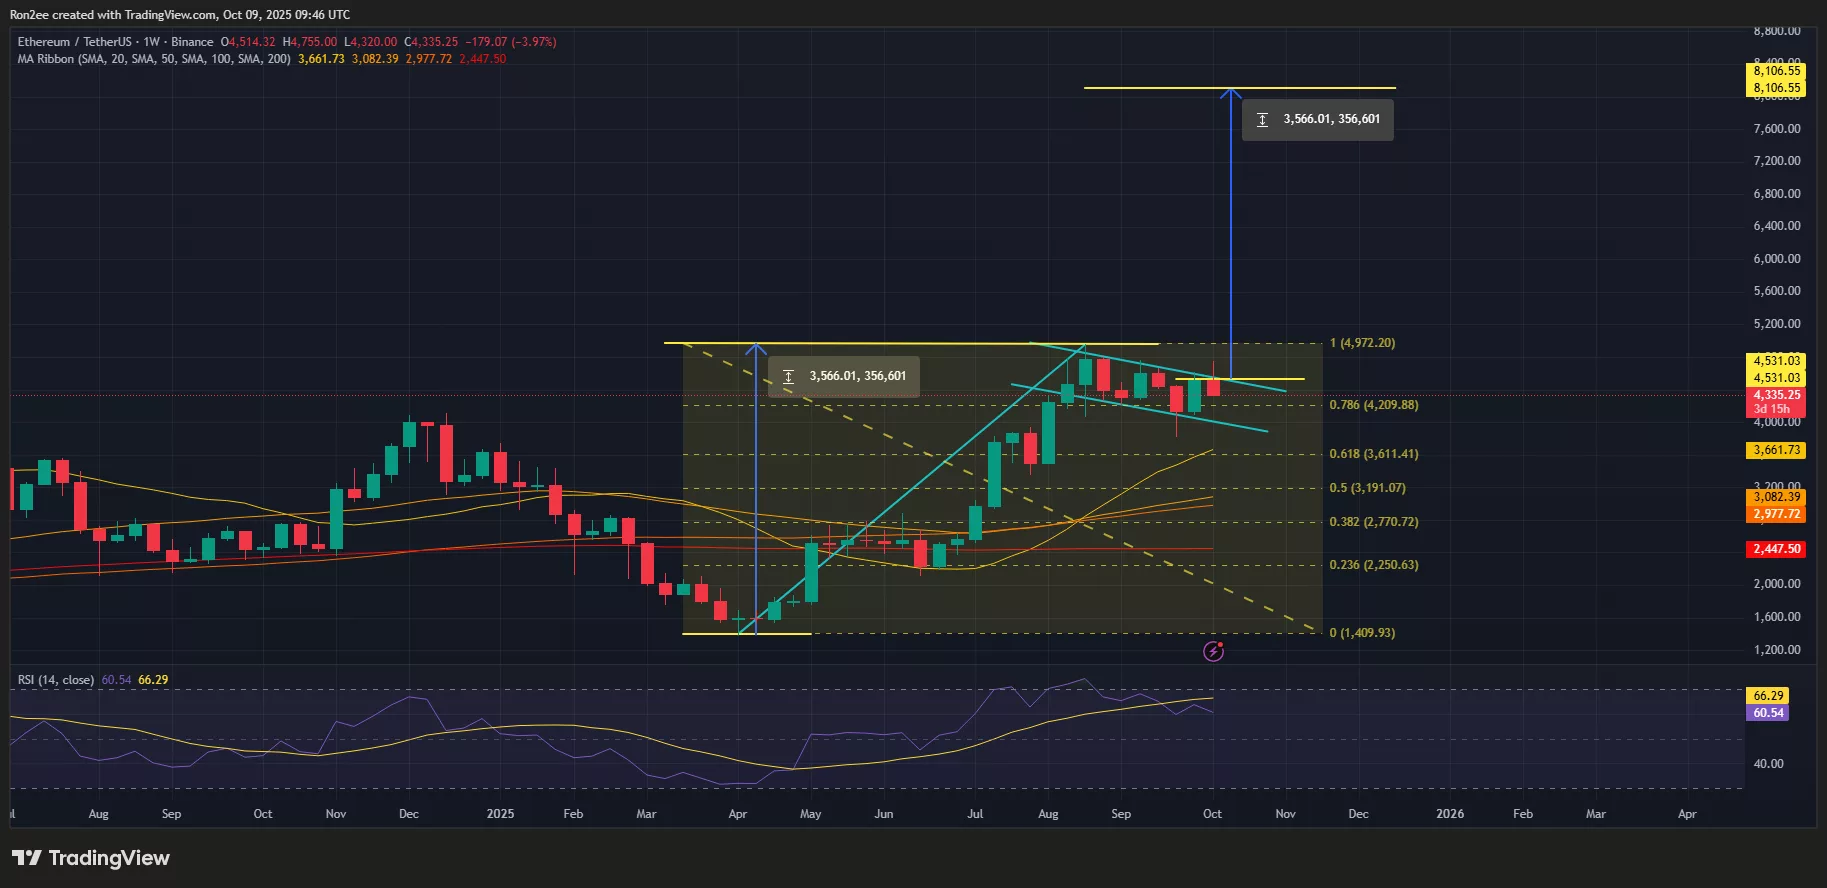
ETH price forms huge bullish continuation pattern on weekly chart — October 9 | Source: crypto.news
At the time of writing, ETH is trading above all major simple moving averages on the weekly chart, and the short-term SMA remains above the long-term SMA, a classic bullish position suggesting continued strength and buyer control.
Meanwhile, the momentum indicator RSI read a value of 61, which means ETH still has room to run before entering overbought territory, giving bulls some breathing room before a serious correction begins.
Zooming in on the daily time frame, the price action also confirms the golden cross, with the 50-day moving average rising above the 200-day. This pattern is typically associated with long-term bullish momentum and historically follows sustained price increases.
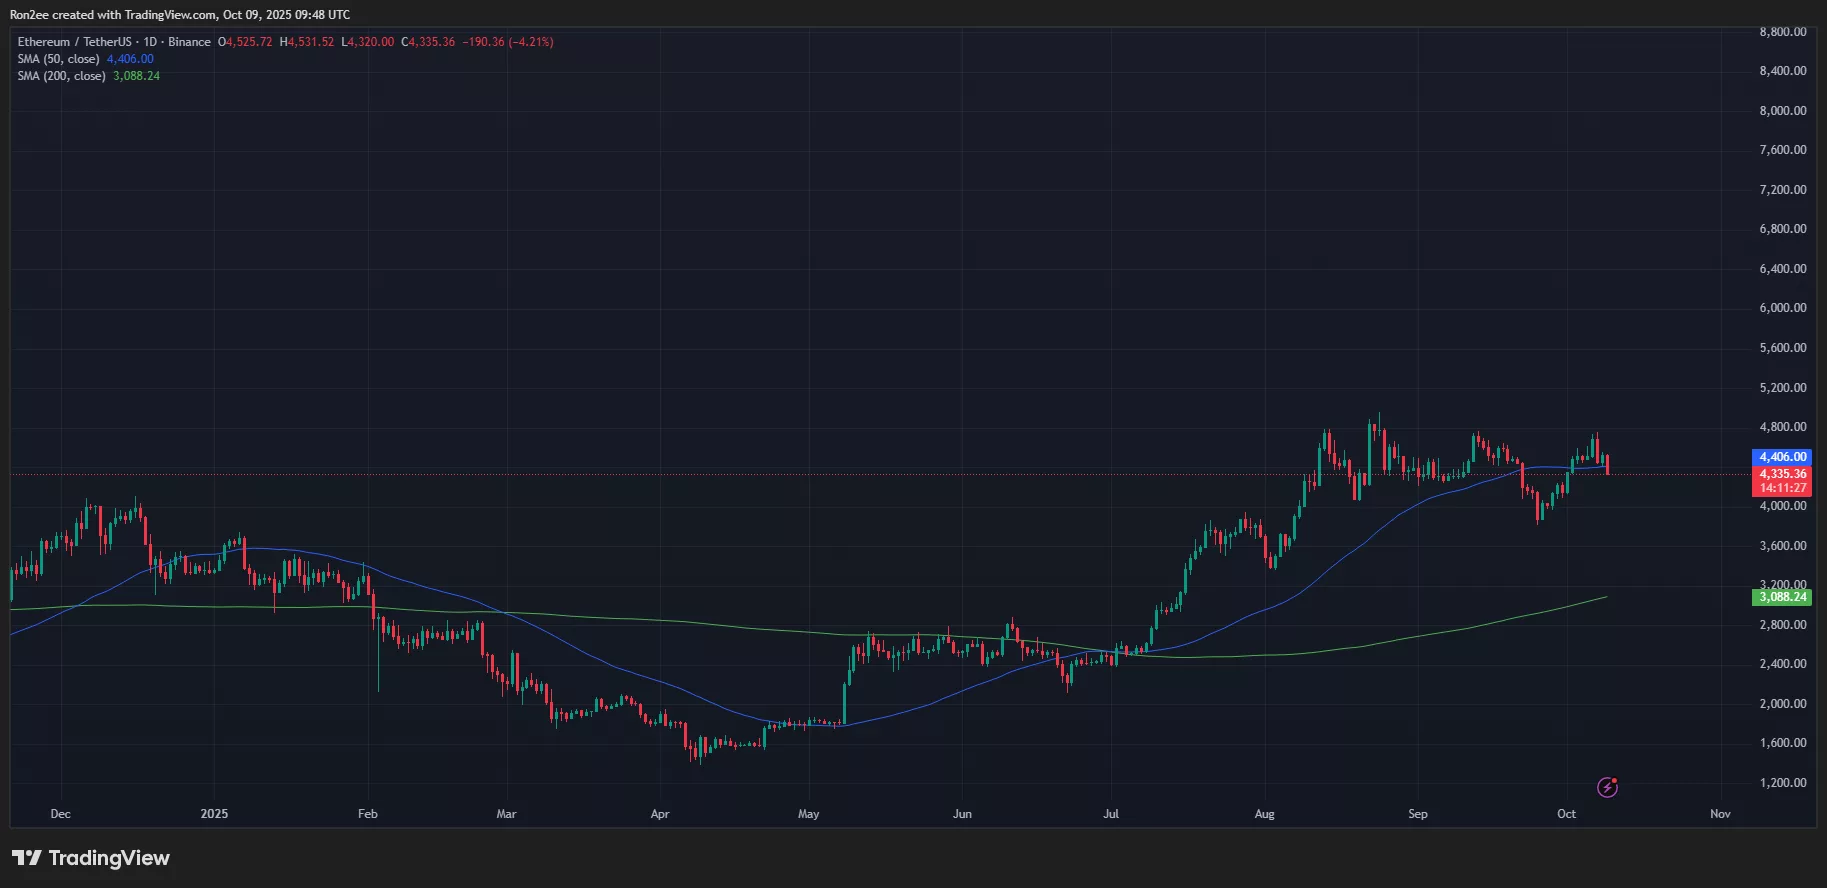
ETH price trend confirms golden cross on daily chart — October 9 | Source: crypto.news
For now, the main resistance level for ETH price is $4,500, which is a psychological barrier and coincides with the upper bound of the bull market pattern.
A clean breakout of this zone would confirm the pattern and potentially rekindle ETH’s uptrend, initially towards $5,000, and possibly even towards the actual moving target of $8,100, which is calculated by adding the flagpole height to the breakout point.
However, some market watchers are urging caution as ETH approaches a major support area. According to renowned analyst Ted Pillows, Ethereum needs to maintain the support zone between $4,250 and $4,300 to maintain its bullish setup.
A decisive break below this range could invalidate the pattern and open the door for a deeper correction towards $4,000 in the coming weeks.
read more: Solana financial company Helius focuses on 5% of supply, going public to strengthen strategy
Disclosure: This article does not represent investment advice. The content and materials published on this page are for educational purposes only.