


Data shows that Ethereum’s funding rate has fallen into the negative zone. Here’s what has typically followed this trend over the past two months:
Ethereum funding rate suggests traders are currently bearish
As analysis firm Santiment explained in a new post on X, shorts currently dominate the Ethereum derivatives market. The indicator of relevance here is the ‘funding rate’, which measures the amount of recurring fees that traders exchange with each other on various derivatives platforms.
A positive value of this indicator means that long holders are paying a premium to holders with short bets to hold their positions. Such a trend means that bullish sentiment is predominant.
On the other hand, the indicator falling below the zero mark suggests that derivatives traders overall may be harboring bearish sentiment as short positions outweigh long positions.
Here, the chart shared by Santiment shows the trend of Ethereum funding rates across all exchanges over the past two months.
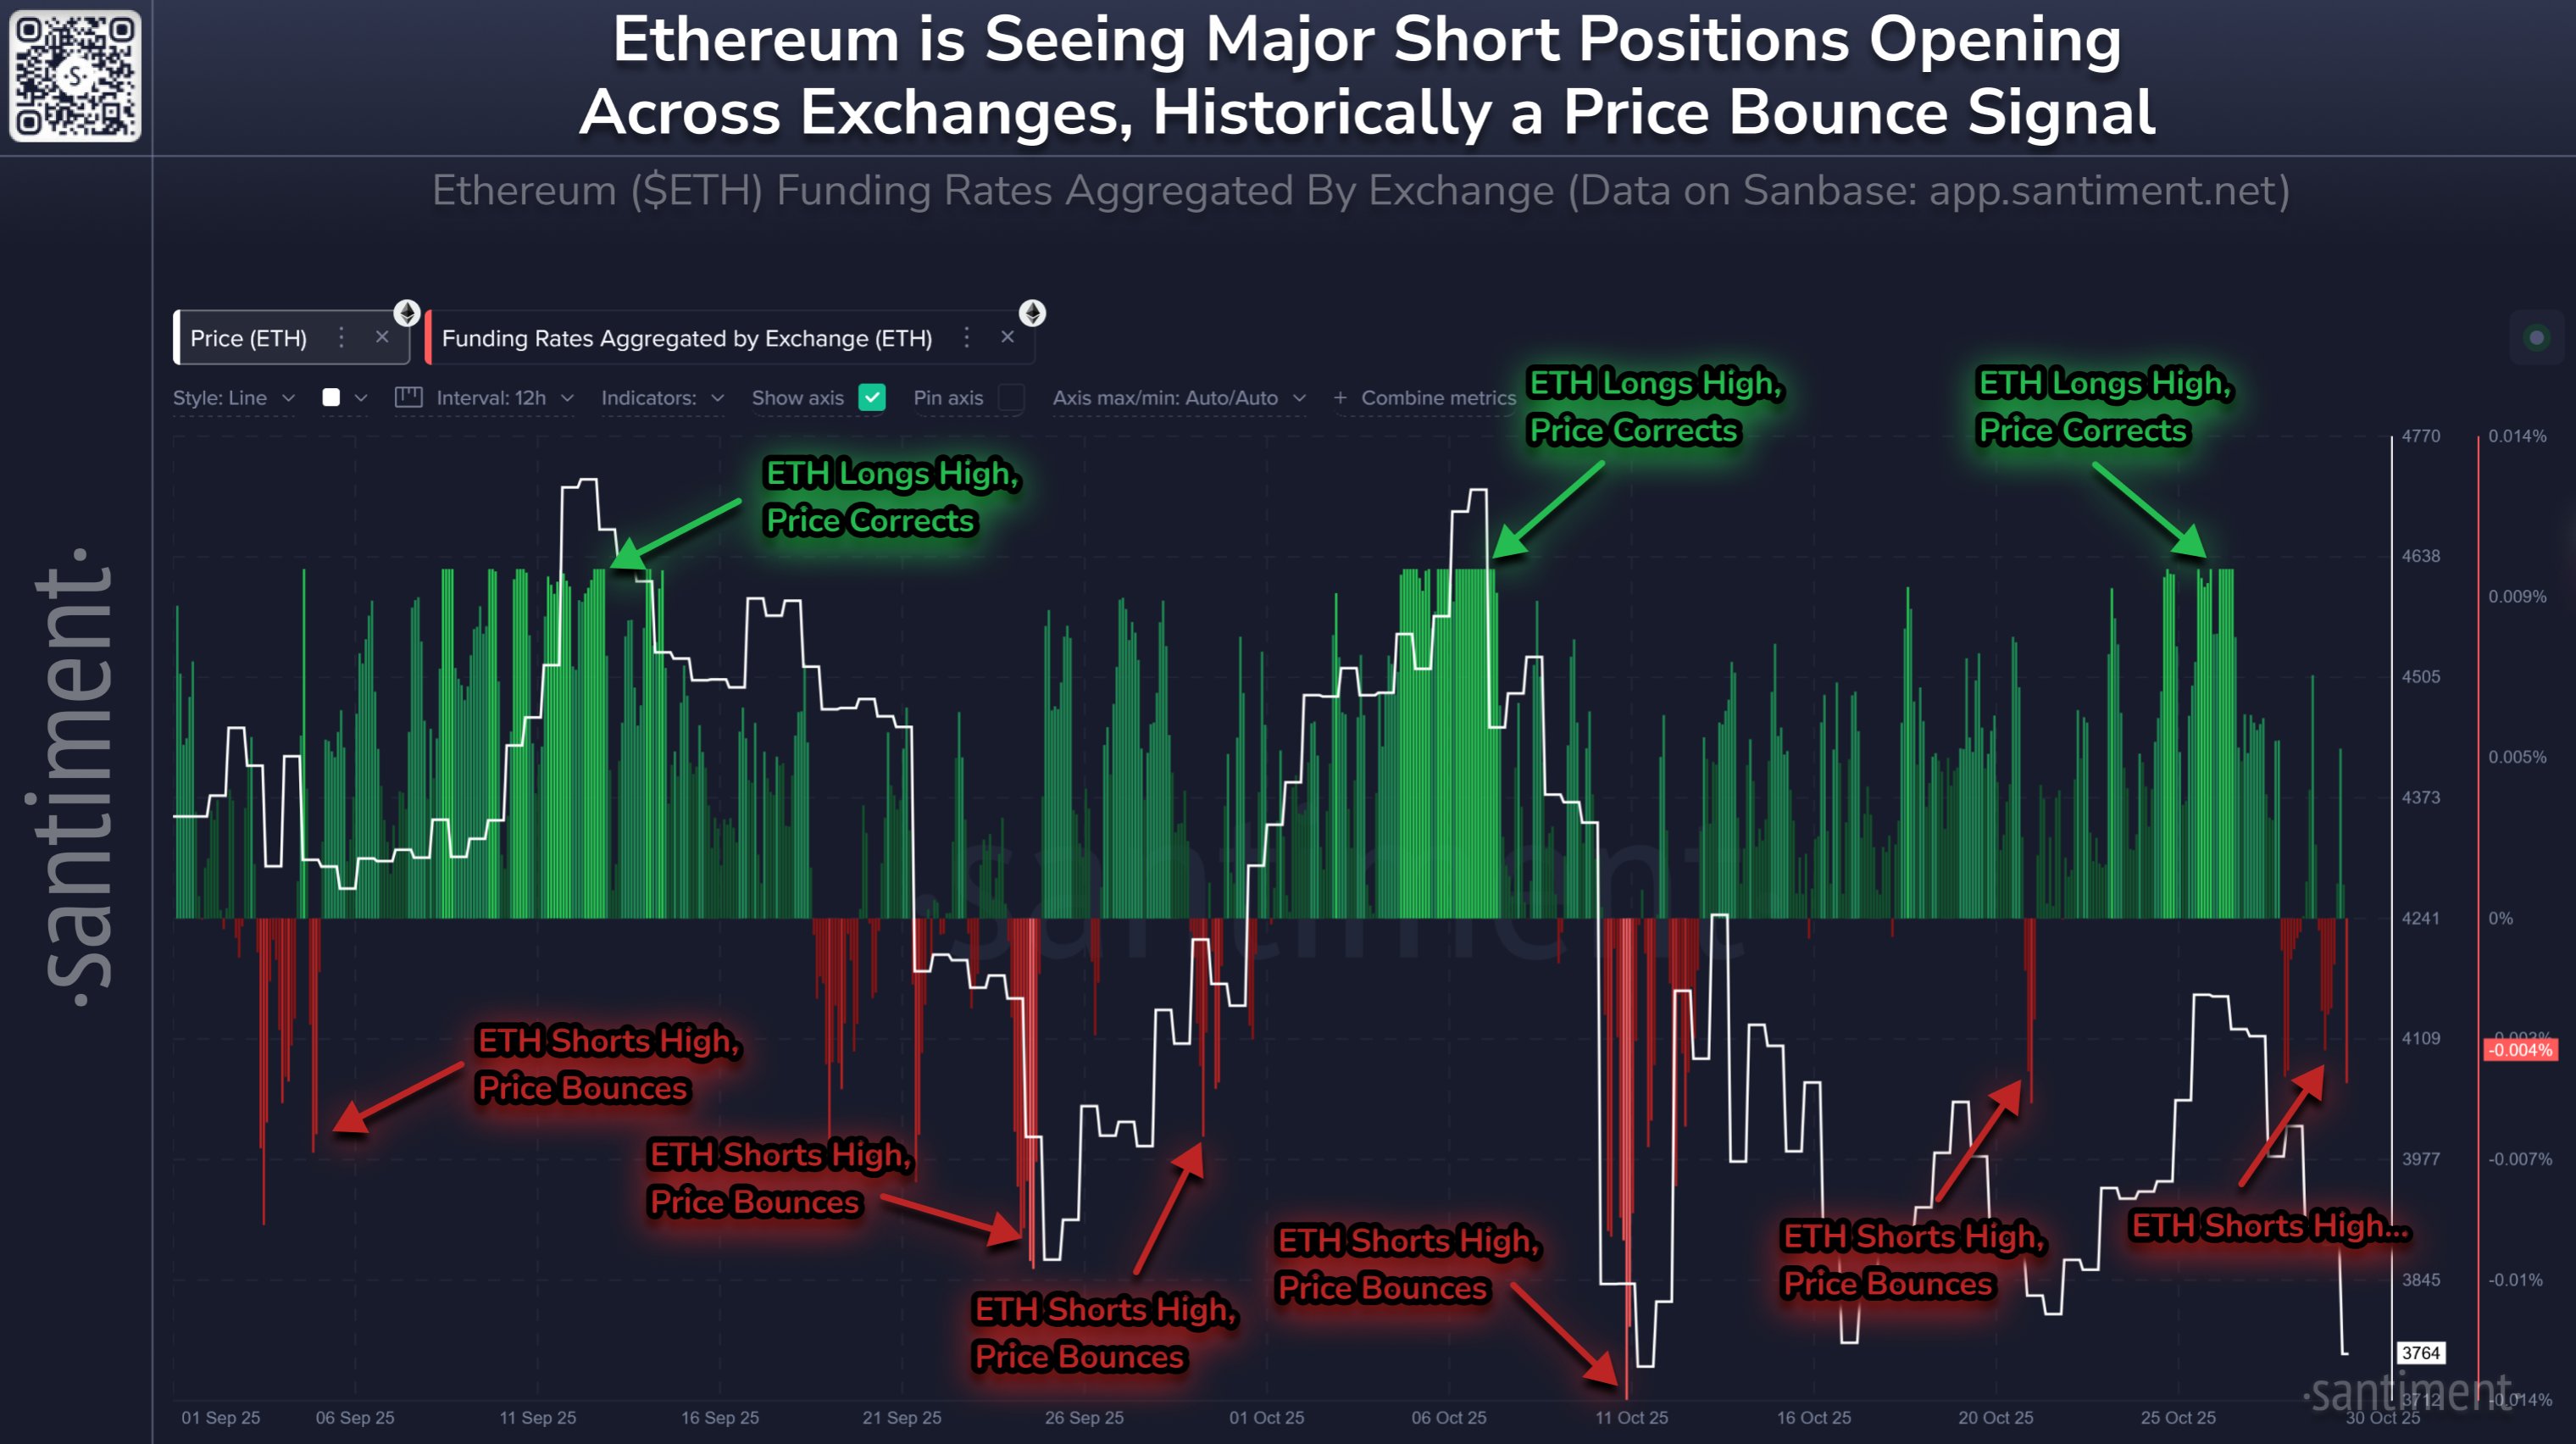
Looks like the value of the metric has been negative in recent days | Source: Santiment on X
As shown in the graph above, the Ethereum funding rate has recently witnessed a decline into the negative zone, which means that the balance of the derivatives market is shifting towards bearish positions.
However, the red market sentiment may not actually be negative for the price of cryptocurrencies. In the graph, the analytics firm highlighted the pattern that assets followed according to this indicator over the past two months.
In this window, ETH appears to be trending against the funding rate. That is, a significant positive level will lead to a price correction, and a negative level will lead to a price rebound.
The explanation behind this trend may lie in the fact that the dominant side of the market is more likely to be caught up in a liquidation squeeze. Such events tend to be violent and involve a cascade of liquidations that feed back into price movements.
Ethereum’s funding rate is in the red, but it remains to be seen whether it will continue this time as its value is not as negative as the previous lows that caused the short squeeze.
In other news, institutional DeFi solutions provider Sentora revealed on XPost that Ethereum has seen significant net currency outflows of approximately $643 million over the past week.
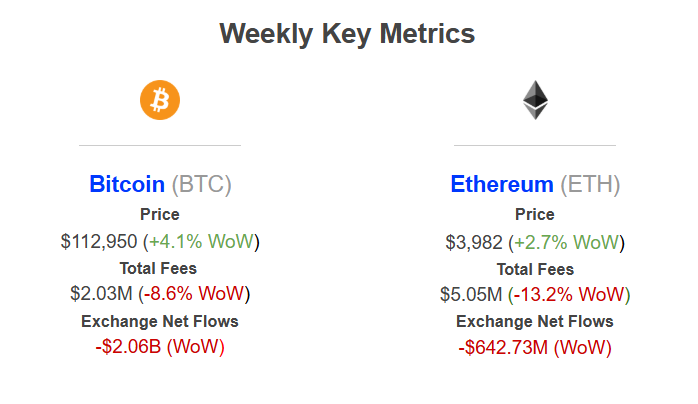
The outflows BTC and ETH have seen during the past week | Source: Sentora on X
Bitcoin saw even larger exchange withdrawals of over $2 billion. “This is a strong bullish signal despite market uncertainty, as investors are moving coins into private vaults for long-term holding,” Centra explained.
ETH price
As of this writing, Ethereum is trading around $3,850, up over 2% in the past 24 hours.
The price of the coin appears to have been going down over the last few days | Source: ETHUSDT on TradingView
Featured images from Dall-E, Santiment.net, Sentora.com, charts from TradingView.com
editing process for is focused on providing thoroughly researched, accurate, and unbiased content. We adhere to strict sourcing standards, and each page is carefully reviewed by our team of top technology experts and experienced editors. This process ensures the integrity, relevance, and value of your content to your readers.