


Ethereum (ETH) is trading around $4,500 after falling 4% in the past 24 hours.
Despite the drop, analysts are watching to see if prices return to the zone where buyers were previously showing interest. The current 7-day change is still positive, with ETH up 5% over the week.
ETH/BTC pullback could present an opportunity
Michael van de Poppe shared a weekly chart of ETH/BTC that showed a strong rally earlier this year. The pair has rallied more than 140% from its lows and hit a high near 0.038. It is currently trading around 0.0365, approaching the support area.
Van de Poppe marked the range between 0.0325 and 0.03 BTC as a possible entry point. This zone has acted as resistance in the past, but is currently located near the 10-week moving average. He also pointed out that the support levels are lower at 0.026, 0.0232, and 0.0194. The current pullback is being driven by lower volumes, which could suggest that selling pressure is easing.
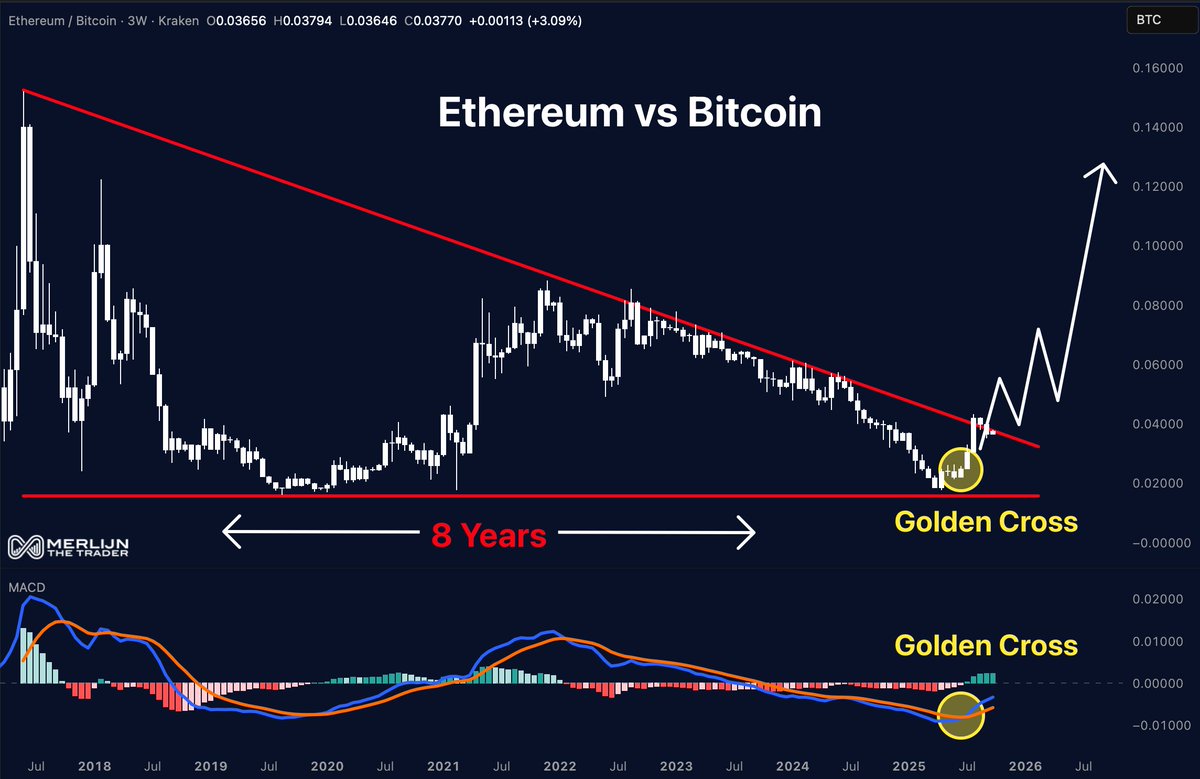
Additionally, Merlijn The Trader posted another ETH/BTC chart showing a move above the trend line that has held for 8 years. This breakout occurred after ETH rebounded from long-term support around 0.020. This change in structure may signal a change in momentum.
The chart also contains golden crosses on both price and MACD. This is the first time in recent years that momentum has turned in favor of ETH on this chart.
“Ethereum doesn’t crawl out of these patterns; it explodes,” Marlin said.
His chart shows a possible path for ETH/BTC towards 0.10-0.12.
You may also like:
- SharpLink Gaming increases unrealized ETH profits by $900 million since converting to DAT
- Bitcoin breaks weekly inflow record with $3.55 billion surge
- Why Ethereum (ETH) could be the biggest winner of the global liquidity surge
Repeat settings are displayed on daily charts
On the daily chart, Trader Tardigrade posted a pattern that has been repeated many times in recent months. In both cases, ETH remained sideways, slightly below the support level, and then rose. These initial setups yielded rapid profits.
The latest move shows ETH falling below $4,600 before rebounding again. This pattern suggests a possible move towards $5,800-$6,200. “Ethereum pump is underway,” he said, suggesting the structure may still be functional.
Key zones remain a challenge
Ali Martinez calls Ethereum’s $4,000 to $4,800 range the “danger zone” from 2021 onwards. His chart shows that ETH has failed at this level several times, followed by a sharp decline. The past six rejections have ranged from 31% to more than 80%.
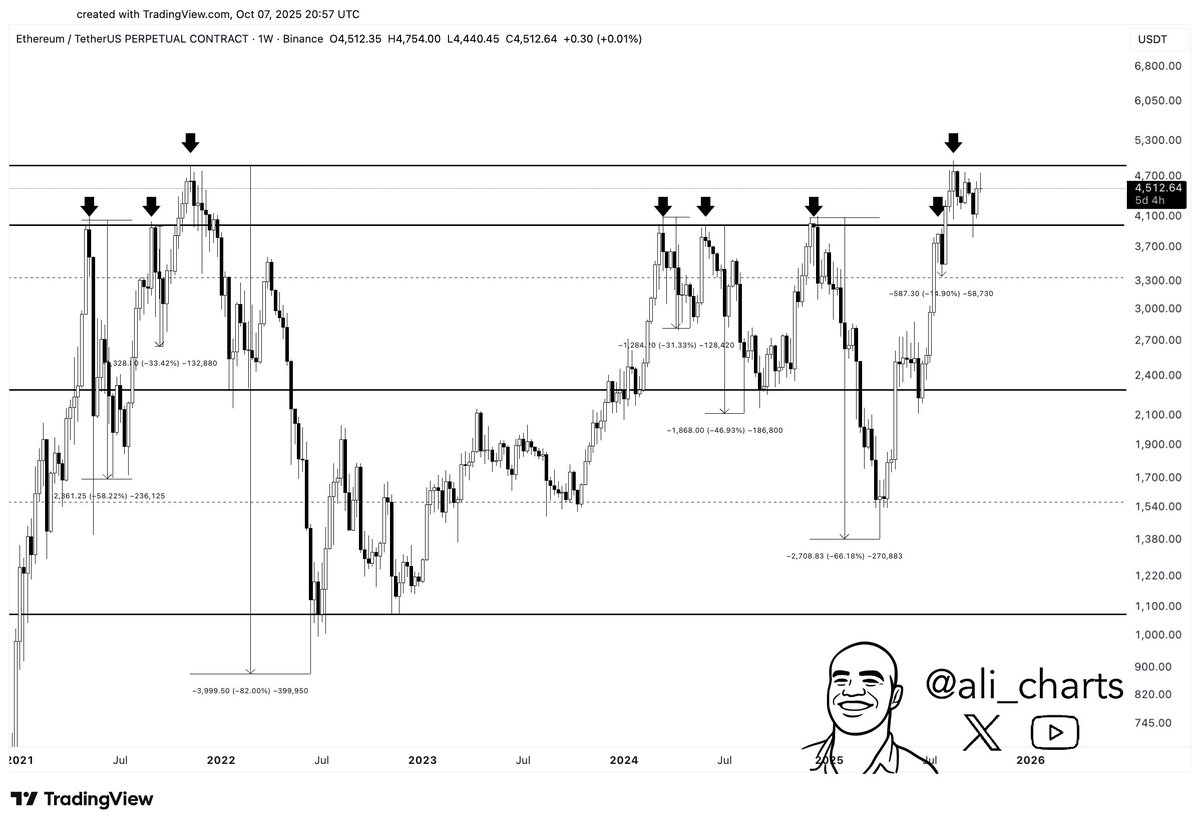
ETH has now returned to the same zone and is trading around $4,500. The chart marks this area as an area of interest. “Every touch leads to correction,” Ali noted, suggesting caution as ETH retests this resistance.