


Ethereum price has struggled to regain the $3,000 level as sustained exchange-traded fund (ETF) outflows and weak derivatives activity strengthen the risk-off backdrop in the market.
summary
- Ethereum is trading below $3,000 due to lower volume and fewer participants in derivatives.
- Spot ETH ETFs recorded daily outflows of $224 million, led by BlackRock’s ETHA.
- The bearish technical structure continues to increase downside risk unless key resistance levels are broken.
Ethereum is trading at $2,919 at the time of writing, down 0.5% in the past 24 hours. The second-largest cryptocurrency has fallen 12% over the past week and is currently trading around 41% below its August all-time high of $4,946.
At the same time, trading activity has cooled significantly. Daily volume fell 27% from the previous session to $22.3 billion, suggesting fewer traders are intervening as prices continue to stall below key resistance levels.
Derivatives data shows traders are reducing exposure. According to CoinGlass data, ETH derivatives trading volume fell 31% to $58 billion, while open interest fell 2.2% to $36.87 billion. Taken together, these movements indicate that positions are being unwound rather than new leverage being added, a move often observed during market declines.
ETH ETF outflows increase for 4th consecutive day
Pressure on Ethereum (ETH) prices has been exacerbated by continued outflows from US spot ETH ETFs. According to data from SoSoValue, the ETH ETF recorded net outflows of $224.26 million on December 16th, marking the fourth consecutive day of withdrawals.
BlackRock’s ETHA led the way in outflows, with $221 million leaving the fund, while Fidelity’s FETH saw only $2.94 million outflows. Weekly ETH ETF outflows now stand at $449 million.
You may also like: BitMine expands Ethereum reserves, aims for $20,000 ETH amid AI growth
On the same day, investors withdrew $277 million from the Bitcoin ETF. The move brought total outflows across the BTC and ETH funds to more than $500 million, the largest single-day outflow in nearly two weeks.
Market sentiment remains weighed down by macro uncertainty and overall weakness, and financial institutions appear to be taking a more cautious approach in reducing exposure. 2025 has been a strong year for crypto-focused institutional products, but recent trends suggest this momentum is slowing.
According to the data, in the fourth quarter of 2025 alone, the Ethereum ETF experienced net outflows of approximately $1.8 billion, reversing much of its previous inflow strength.
Ethereum price technical analysis
Ethereum is still in a clear medium-term downtrend, with the price lowering its highs and lowering its lows. So far, all bounces have been capped below previous swing highs.
On the daily chart, ETH is hovering below the Bollinger Band, which usually indicates a trend is continuing rather than reversing. The 20-day simple moving average, the center line of the Bollinger Bands, has repeatedly acted as resistance, halting recent attempts at a rebound.
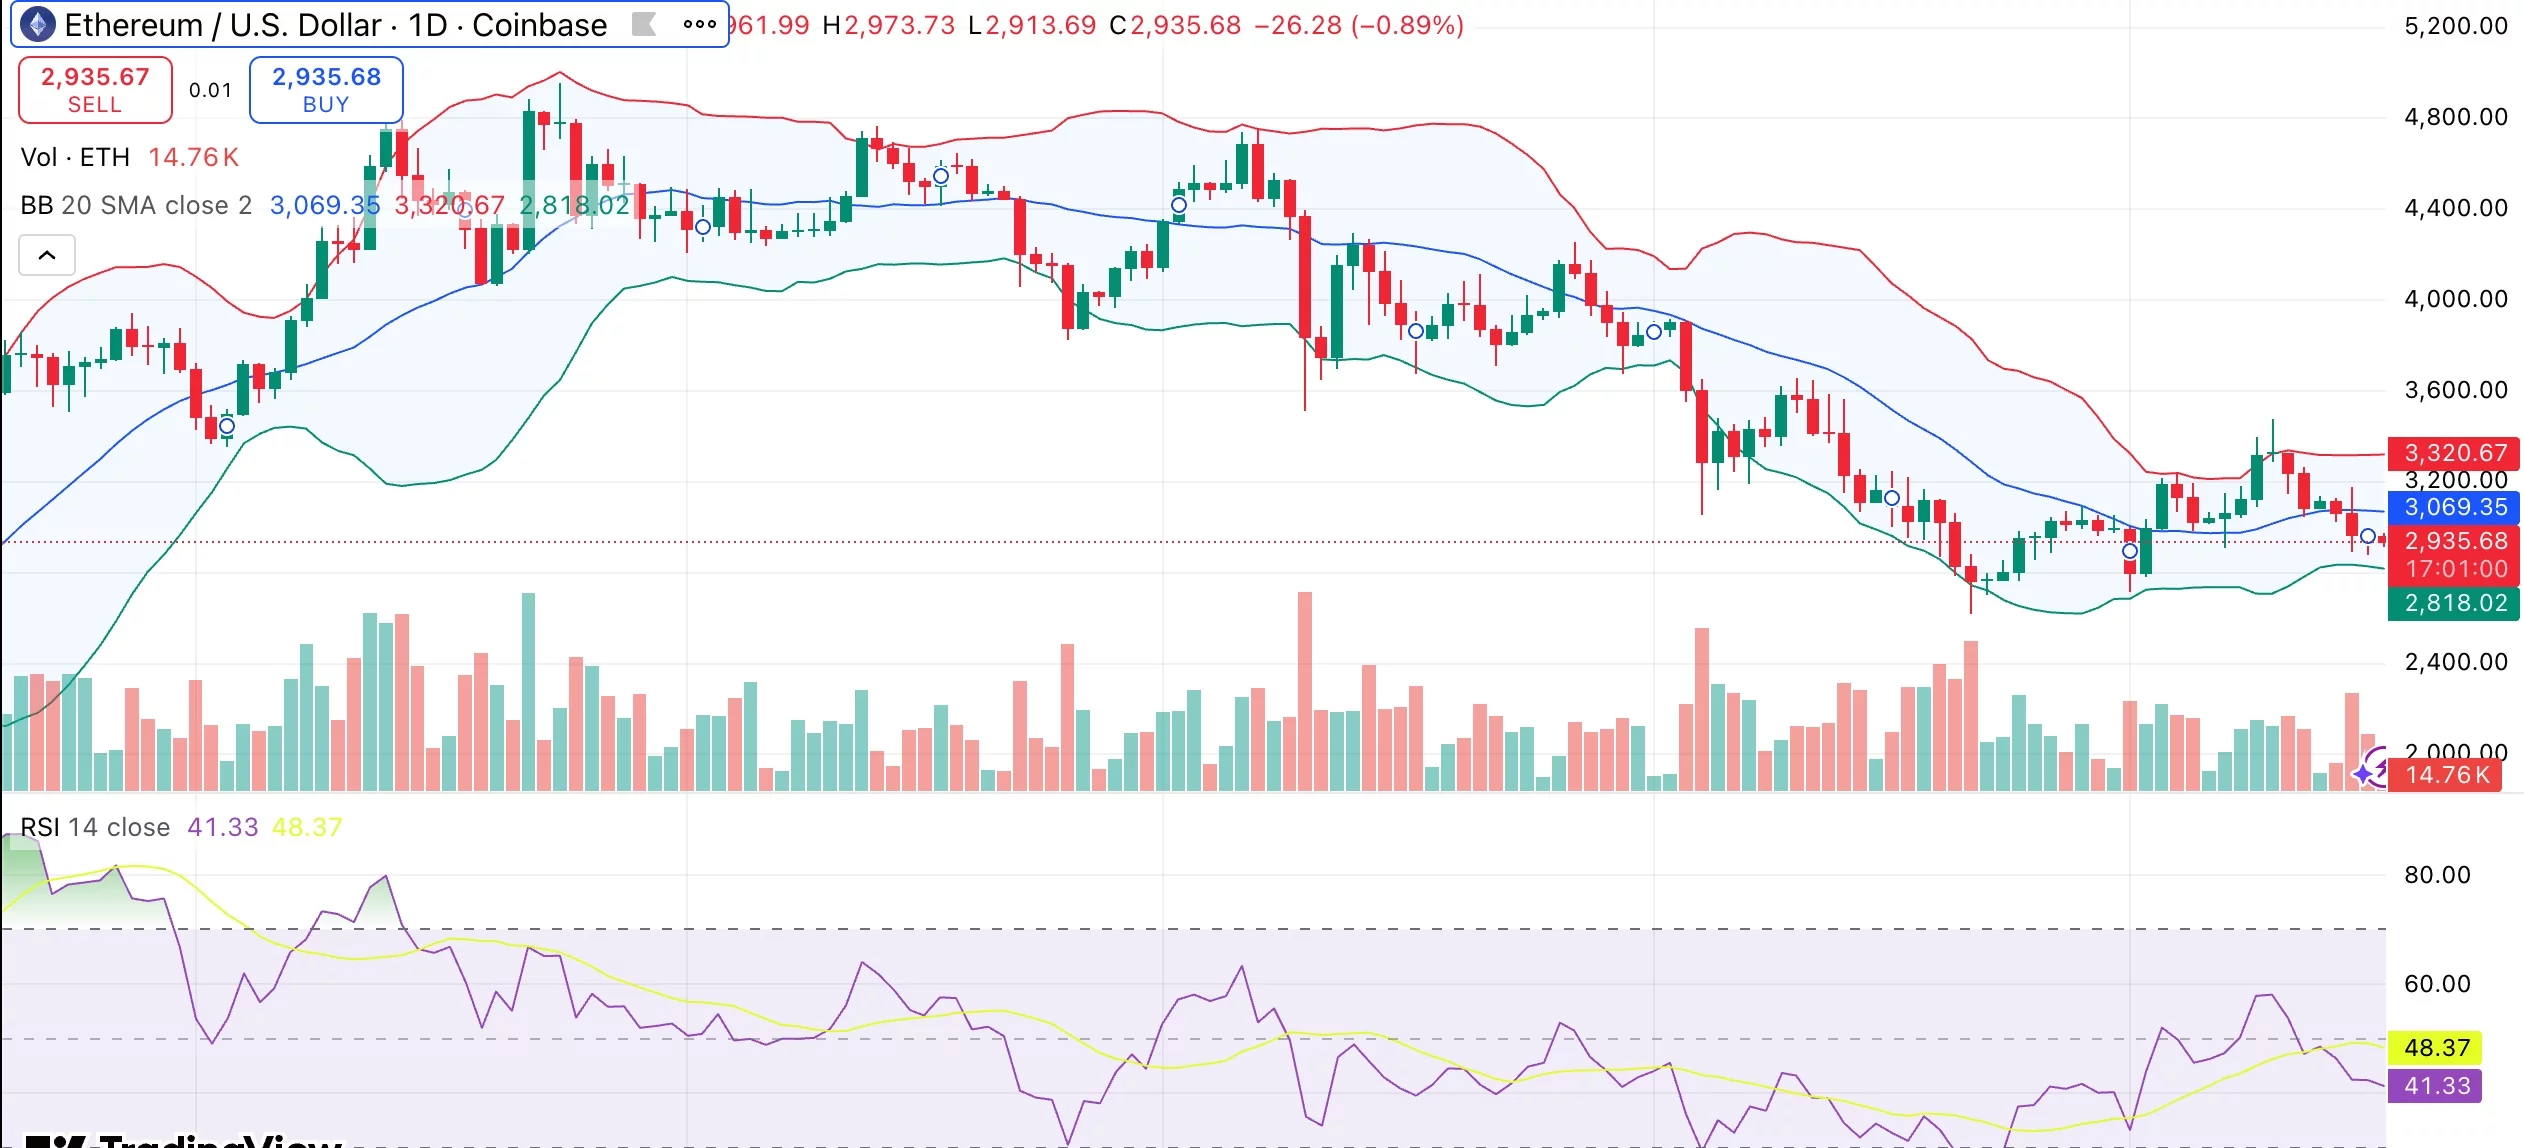
Technical analysis of Ethereum price. Credit: crypto.news
The Bollinger Bands are reasonably wide, indicating that volatility is still moving in one direction. Therefore, a sudden rally is unlikely without a strong new catalyst.
Momentum remains skewed in favor of sellers. The 14-day RSI is close to 41, below the neutral mark of 50, and the market remains in bearish territory. There are no obvious bullish signals or divergences between the relative strength index and recent lows.
Other tools such as MACD, momentum indicators, and some moving averages are all showing bearish signals.
For Ethereum to show any signs of a near-term recovery, it needs to break out and stay above the $3,060 to $3,100 range. If $2,900 fails to hold, the downside may continue to be the focus, with $2,800 being the next important support level.
read more: Bitcoin and Ethereum option expirations test maximum pain level December 20th