


Bitcoin prices continued to have a roller-coaster performance last week, soaring to over $113,000 by mid-week before falling back to around $107,000. Although the price trend of this leading cryptocurrency has been stable over the past few days, market uncertainty still seems to be the situation today.
However, Bitcoin price seems to be leaning towards a bearish setup, as suggested by the negative shift of related technical indicators on longer time frames. Here is what happened to BTC price the last four times this indicator turned bearish.
BTC price exposed to 70% risk Correction: Analyst
Cryptocurrency analyst Ali Martinez gave a bearish outlook on the price of Bitcoin in an October 24 post on social media platform X. Online experts revealed that the market leader may have returned to a familiar position that often resulted in significant losses (about 70%) in the past.
This bearish forecast is based on changes in the Moving Average Convergence/Divergence (MACD) indicator, which shows the relationship between moving averages of asset prices (Bitcoin prices in this context). A cross of the MACD line above the signal line is usually a bullish sign for the asset price.
On the other hand, if the MACD line crosses below the signal line, it indicates that the asset may be in a bearish structure. As seen in the highlighted chart, the Bitcoin MACD line just fell below the signal line on the monthly timeframe. This means the flagship cryptocurrency could be poised for a prolonged price decline.
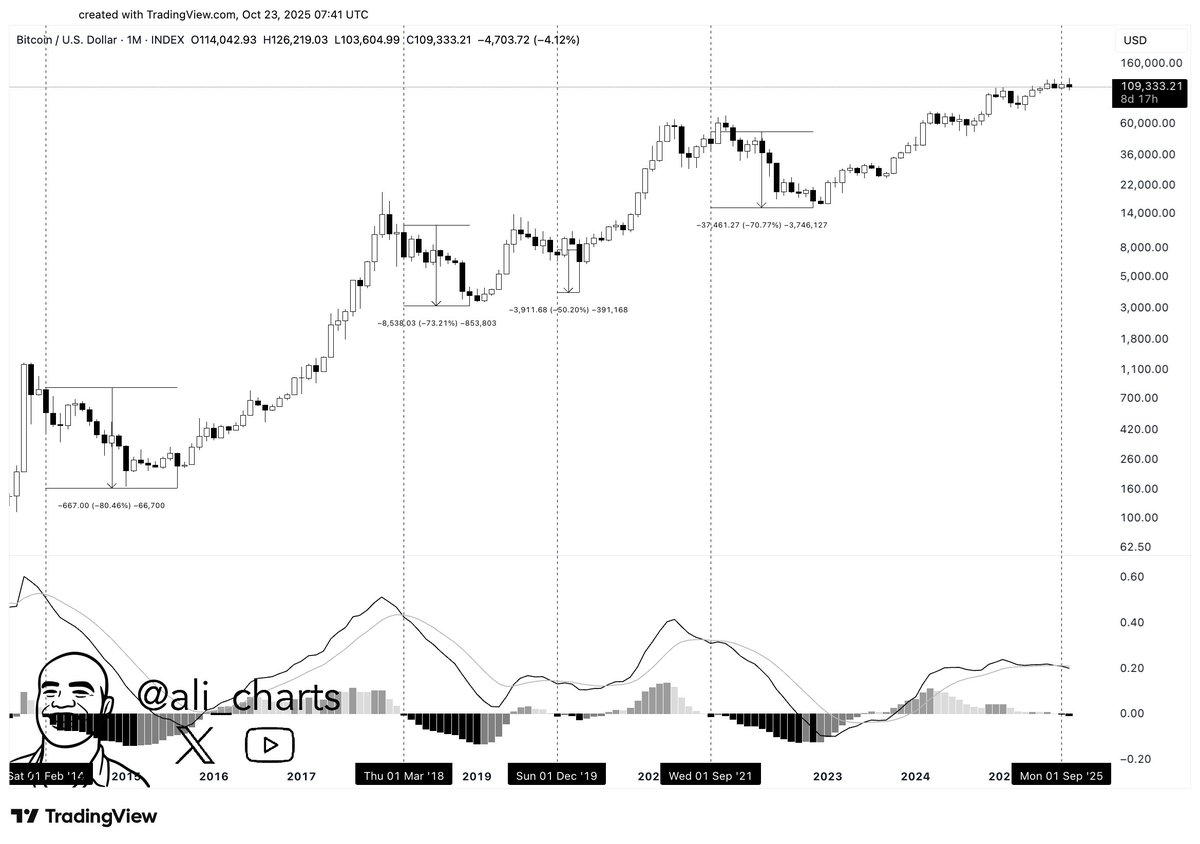
Source: @ali_charts on X
What is even more surprising is that the historical performance of Bitcoin price changes every time this MACD crossover occurs. According to Martinez, the price of BTC has fallen by an average of 70% in the past four times the indicator turned negative.
The last time the moving average convergence/divergence indicator turned bearish was in September 2021, when the market leader finally started to decline, reaching around the $16,000 mark in November 2022. As shown in the graph, Bitcoin price has fallen by more than 70% during this period.
If history is anything to go by, this means the price of BTC is at risk of falling by 70% in the coming months, with a target of around $33,000 from the current price point.
Bitcoin price overview
As of this writing, the price of BTC is around $110,540 and has not changed significantly in the past 24 hours.
The price of BTC on the daily timeframe | Source: BTCUSDT chart on TradingView
Featured image from iStock, chart from TradingView
editing process for is focused on providing thoroughly researched, accurate, and unbiased content. We adhere to strict sourcing standards, and each page is carefully reviewed by our team of top technology experts and experienced editors. This process ensures the integrity, relevance, and value of your content to your readers.